Gallery
oligodendrocyte images: illustrations and micrographs. All credits and licenses listed.
Micrographs
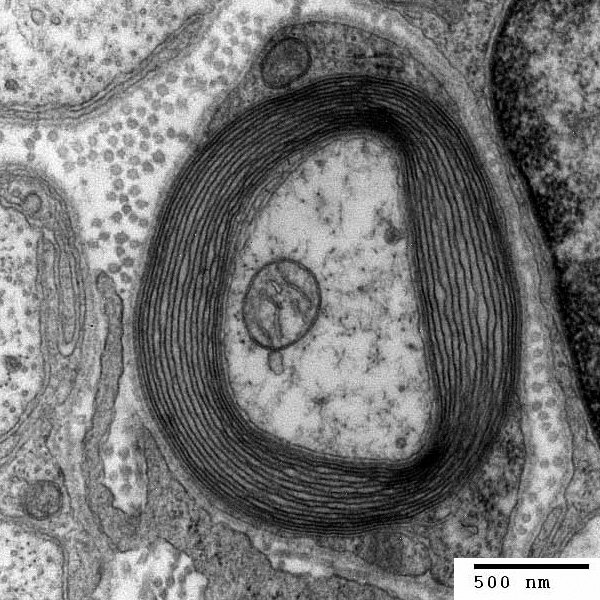
Transmission electron micrograph of a myelinated axon in transverse section. The concentric myelin lamellae are visible surrounding the axon core. The myelin sheath is produced by an oligodendrocyte in the CNS.
user:Roadnottaken (Wikimedia Commons) · undefined · source
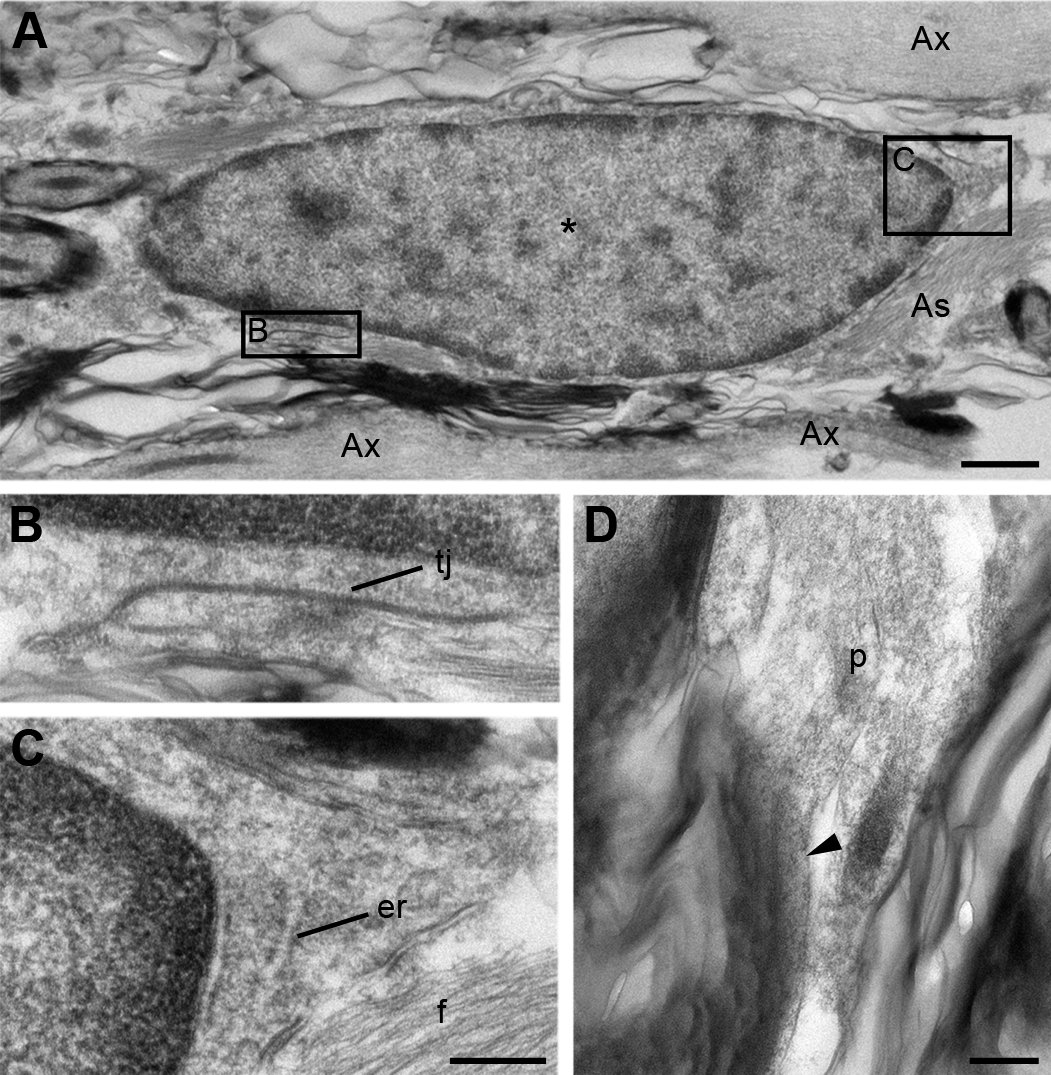
Electron micrograph of an ependyma-derived oligodendrocyte. From Meletis et al., showing the ultrastructure of an oligodendrocyte that arose from ependymal cells after spinal cord injury.
Meletis K, Barnabe-Heider F, Carlen M, Evergren E, Tomilin N et al. (Wikimedia Commons) · undefined · source
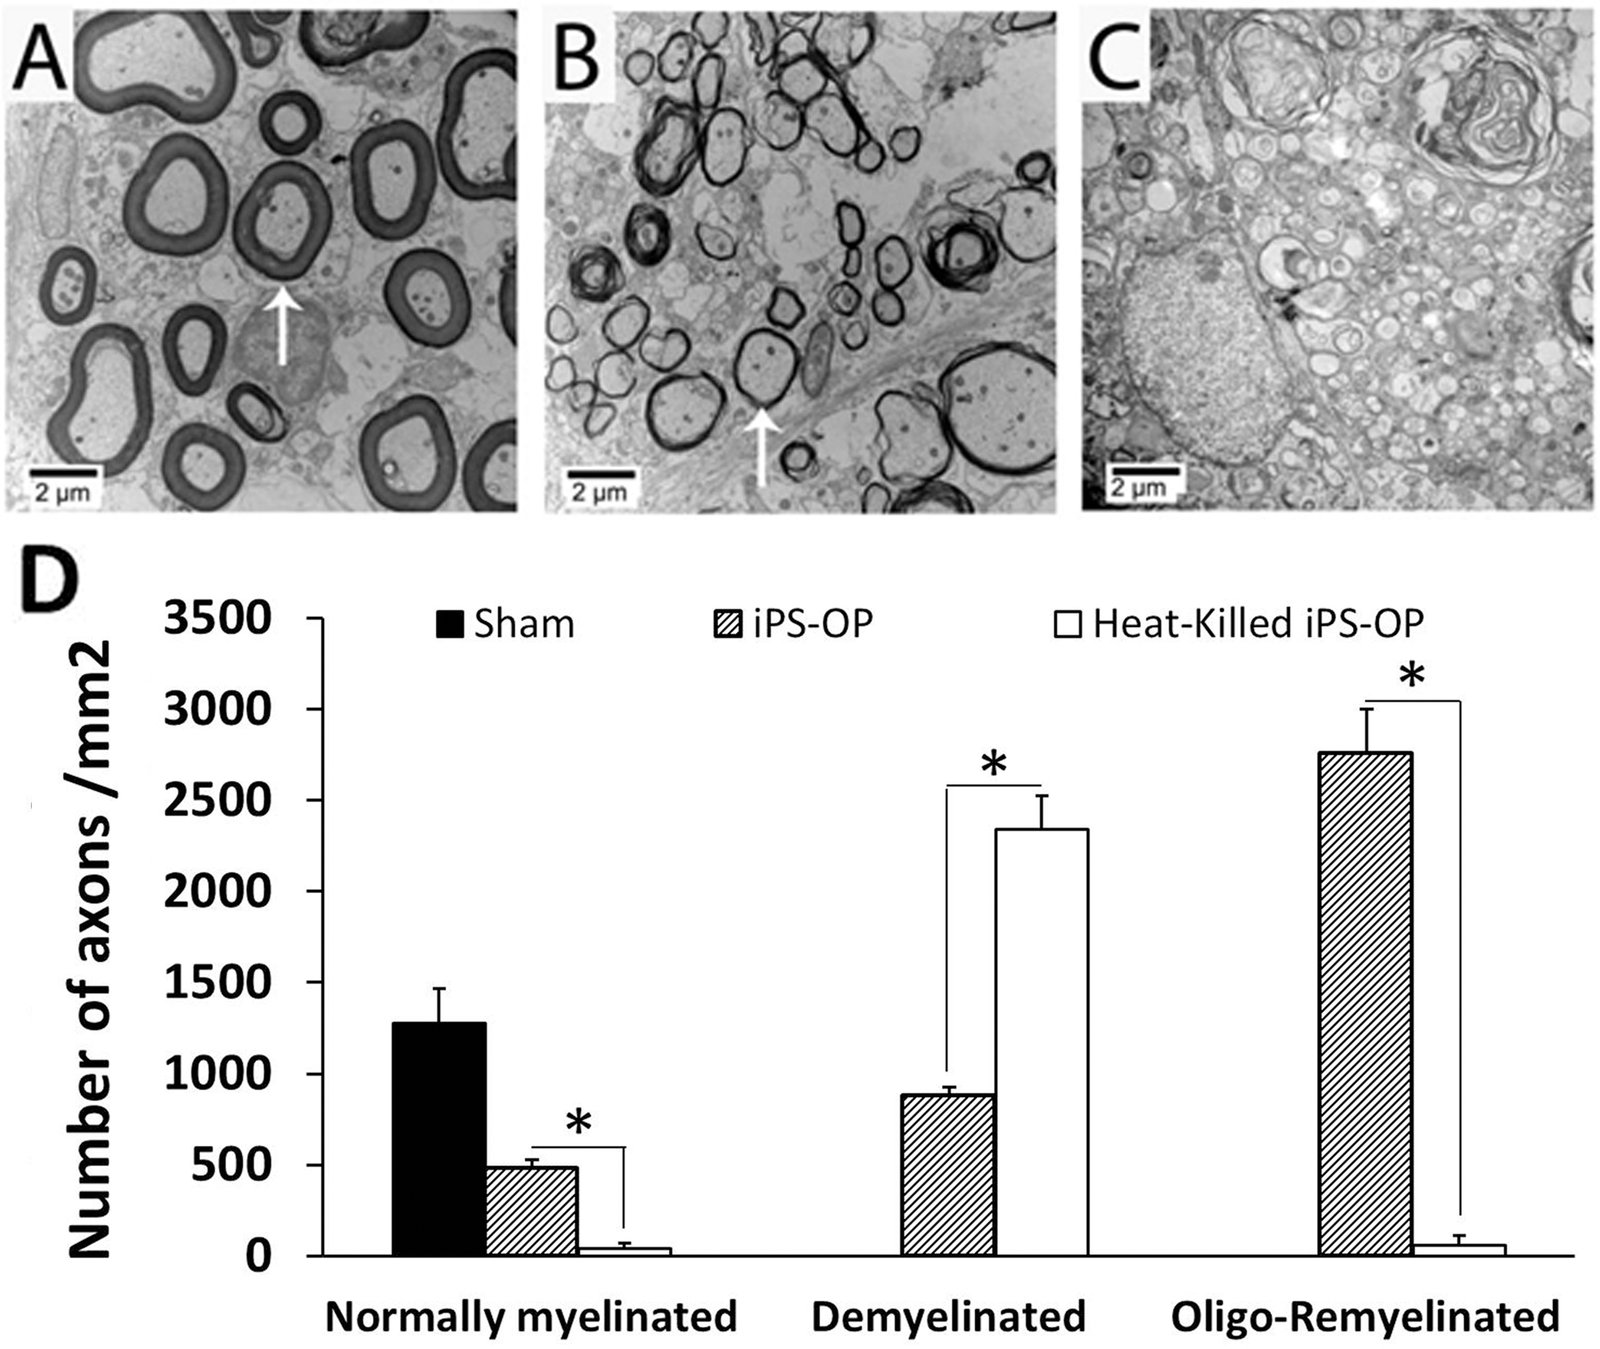
TEM of transverse sections of rat spinal cord showing remyelination of spared axons by iPS-derived OPCs after contusive SCI. Thin remyelinating sheaths are visible around axons.
All AH, Gharibani P, Gupta S, Bazley FA, Pashai N, Chou BK et al. (Wikimedia Commons) · undefined · source
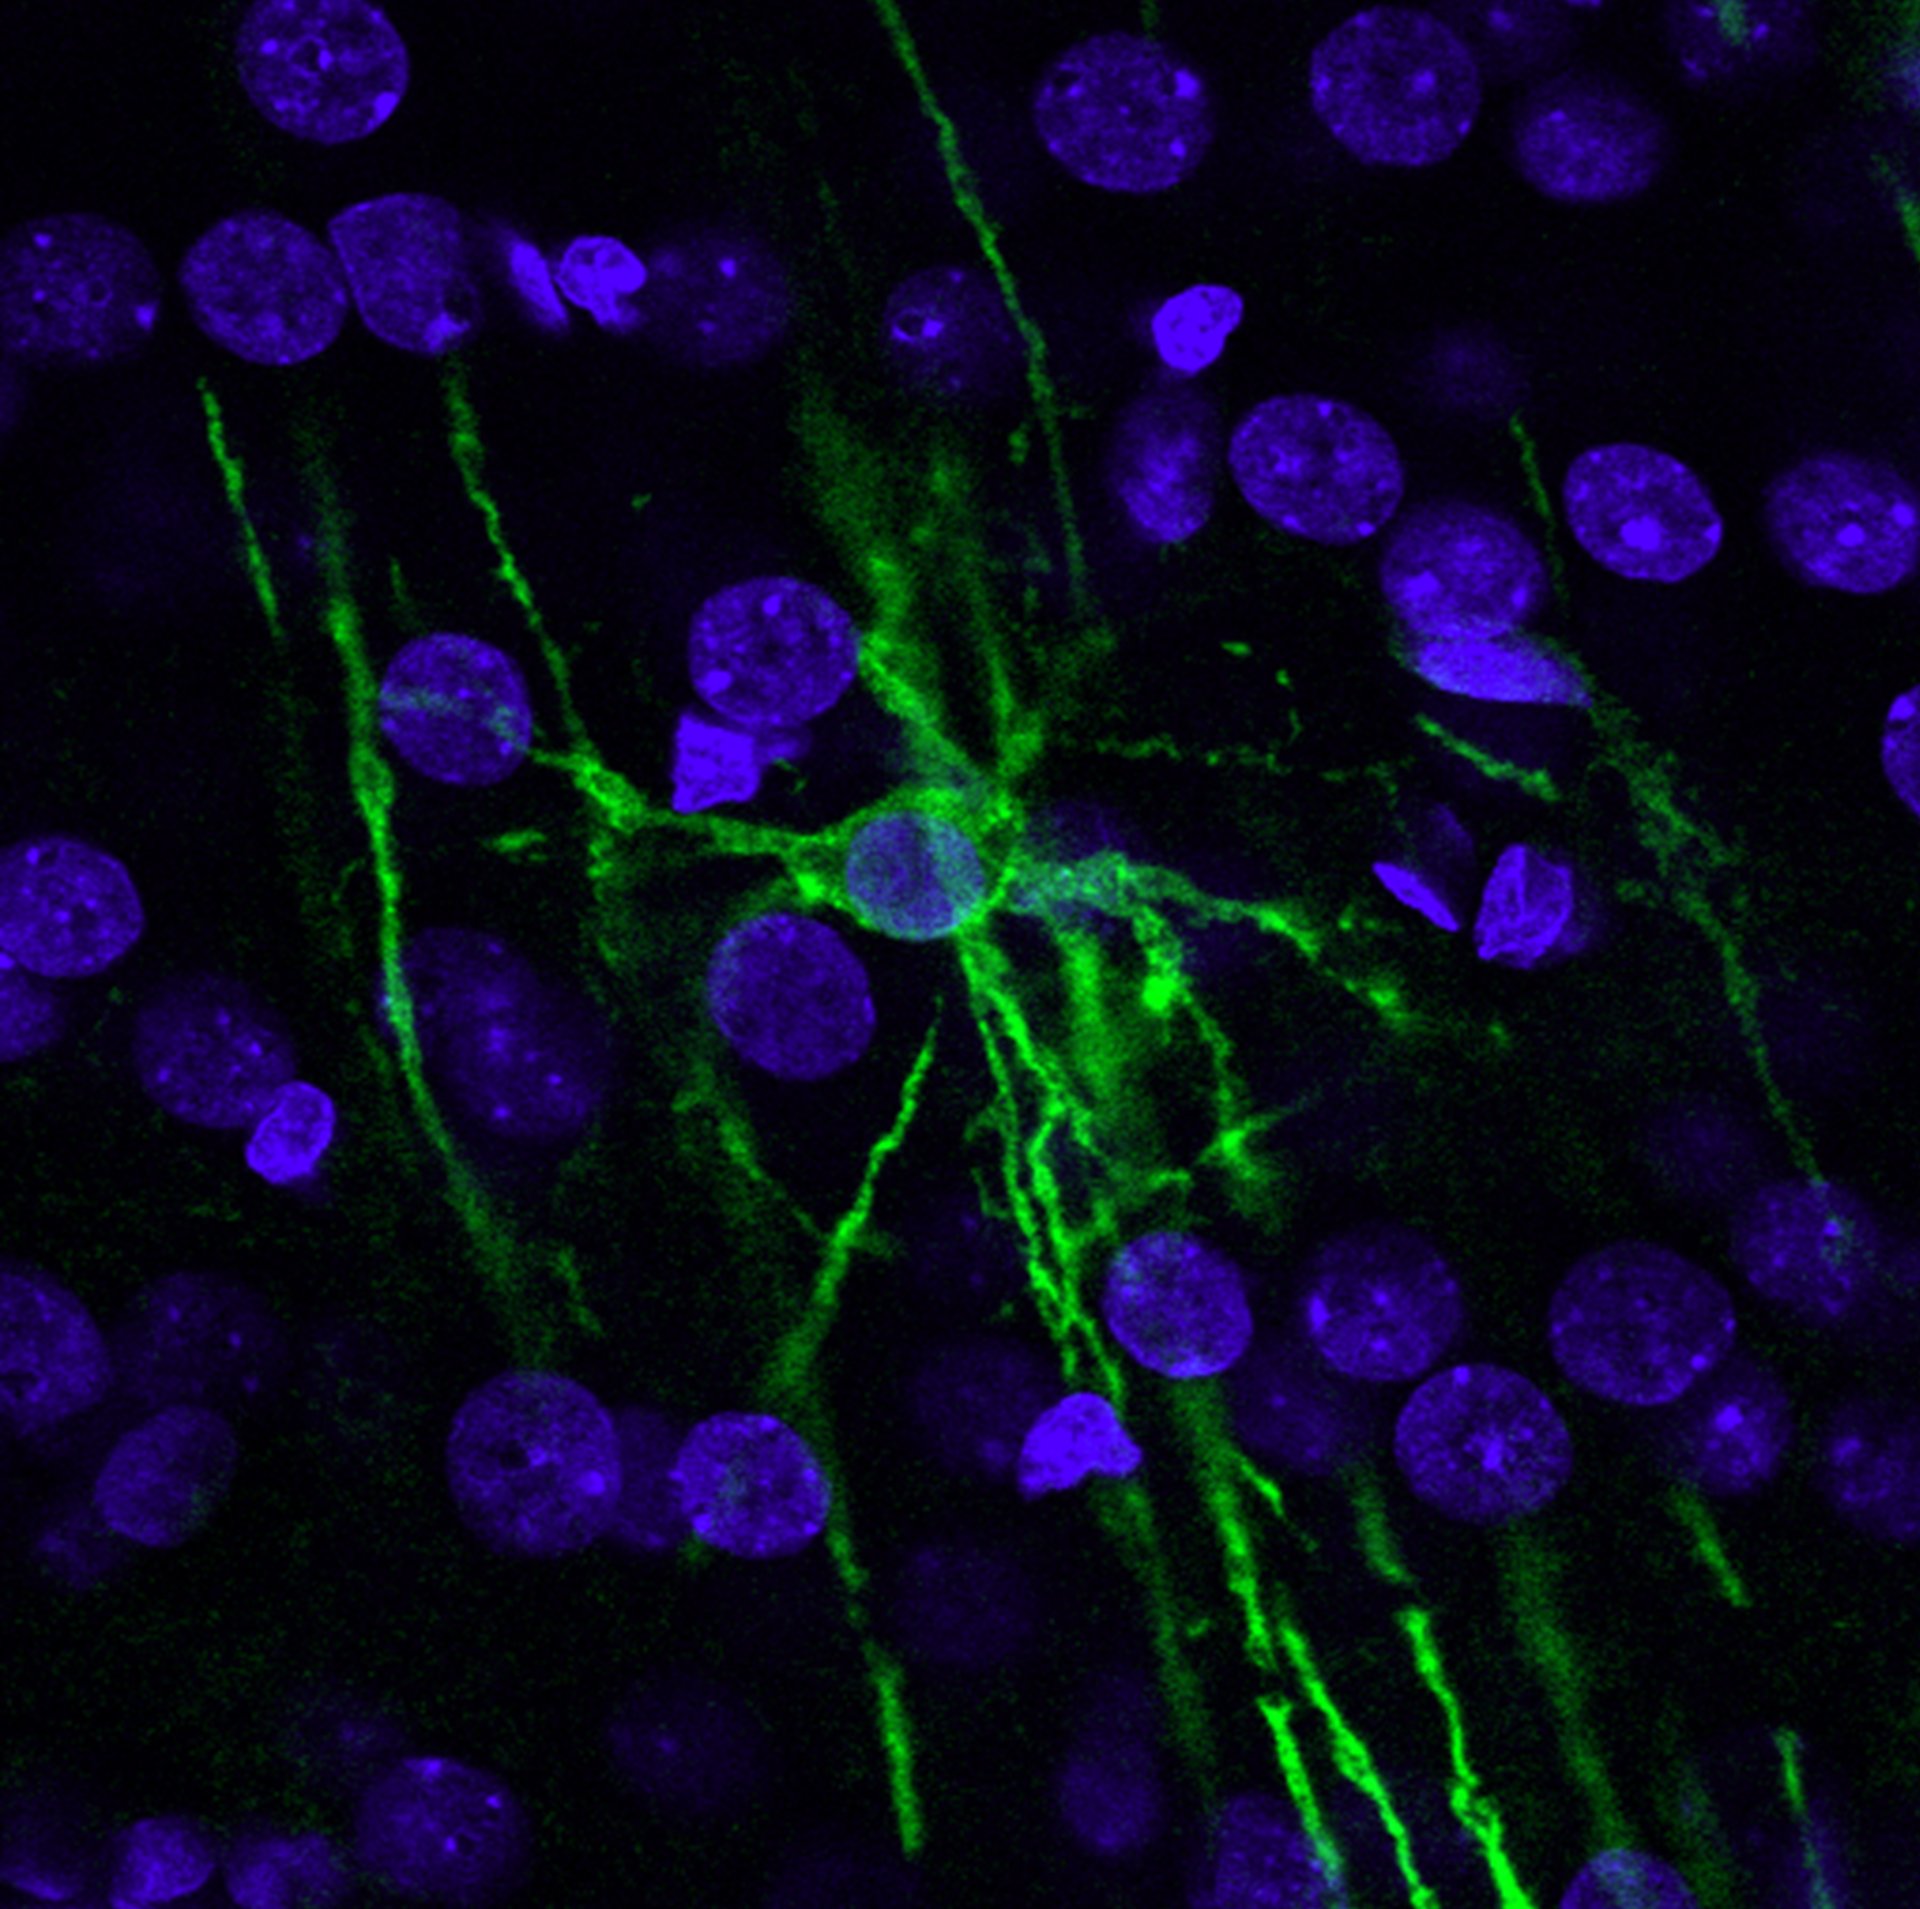
Confocal image of oligodendrocytes in adult mouse brain stained with the Rip antibody (green). Cell nuclei are counterstained with DAPI (blue). The branching processes characteristic of myelinating oligodendrocytes are visible.
Oleg Tsupykov (Wikimedia Commons) · undefined · source
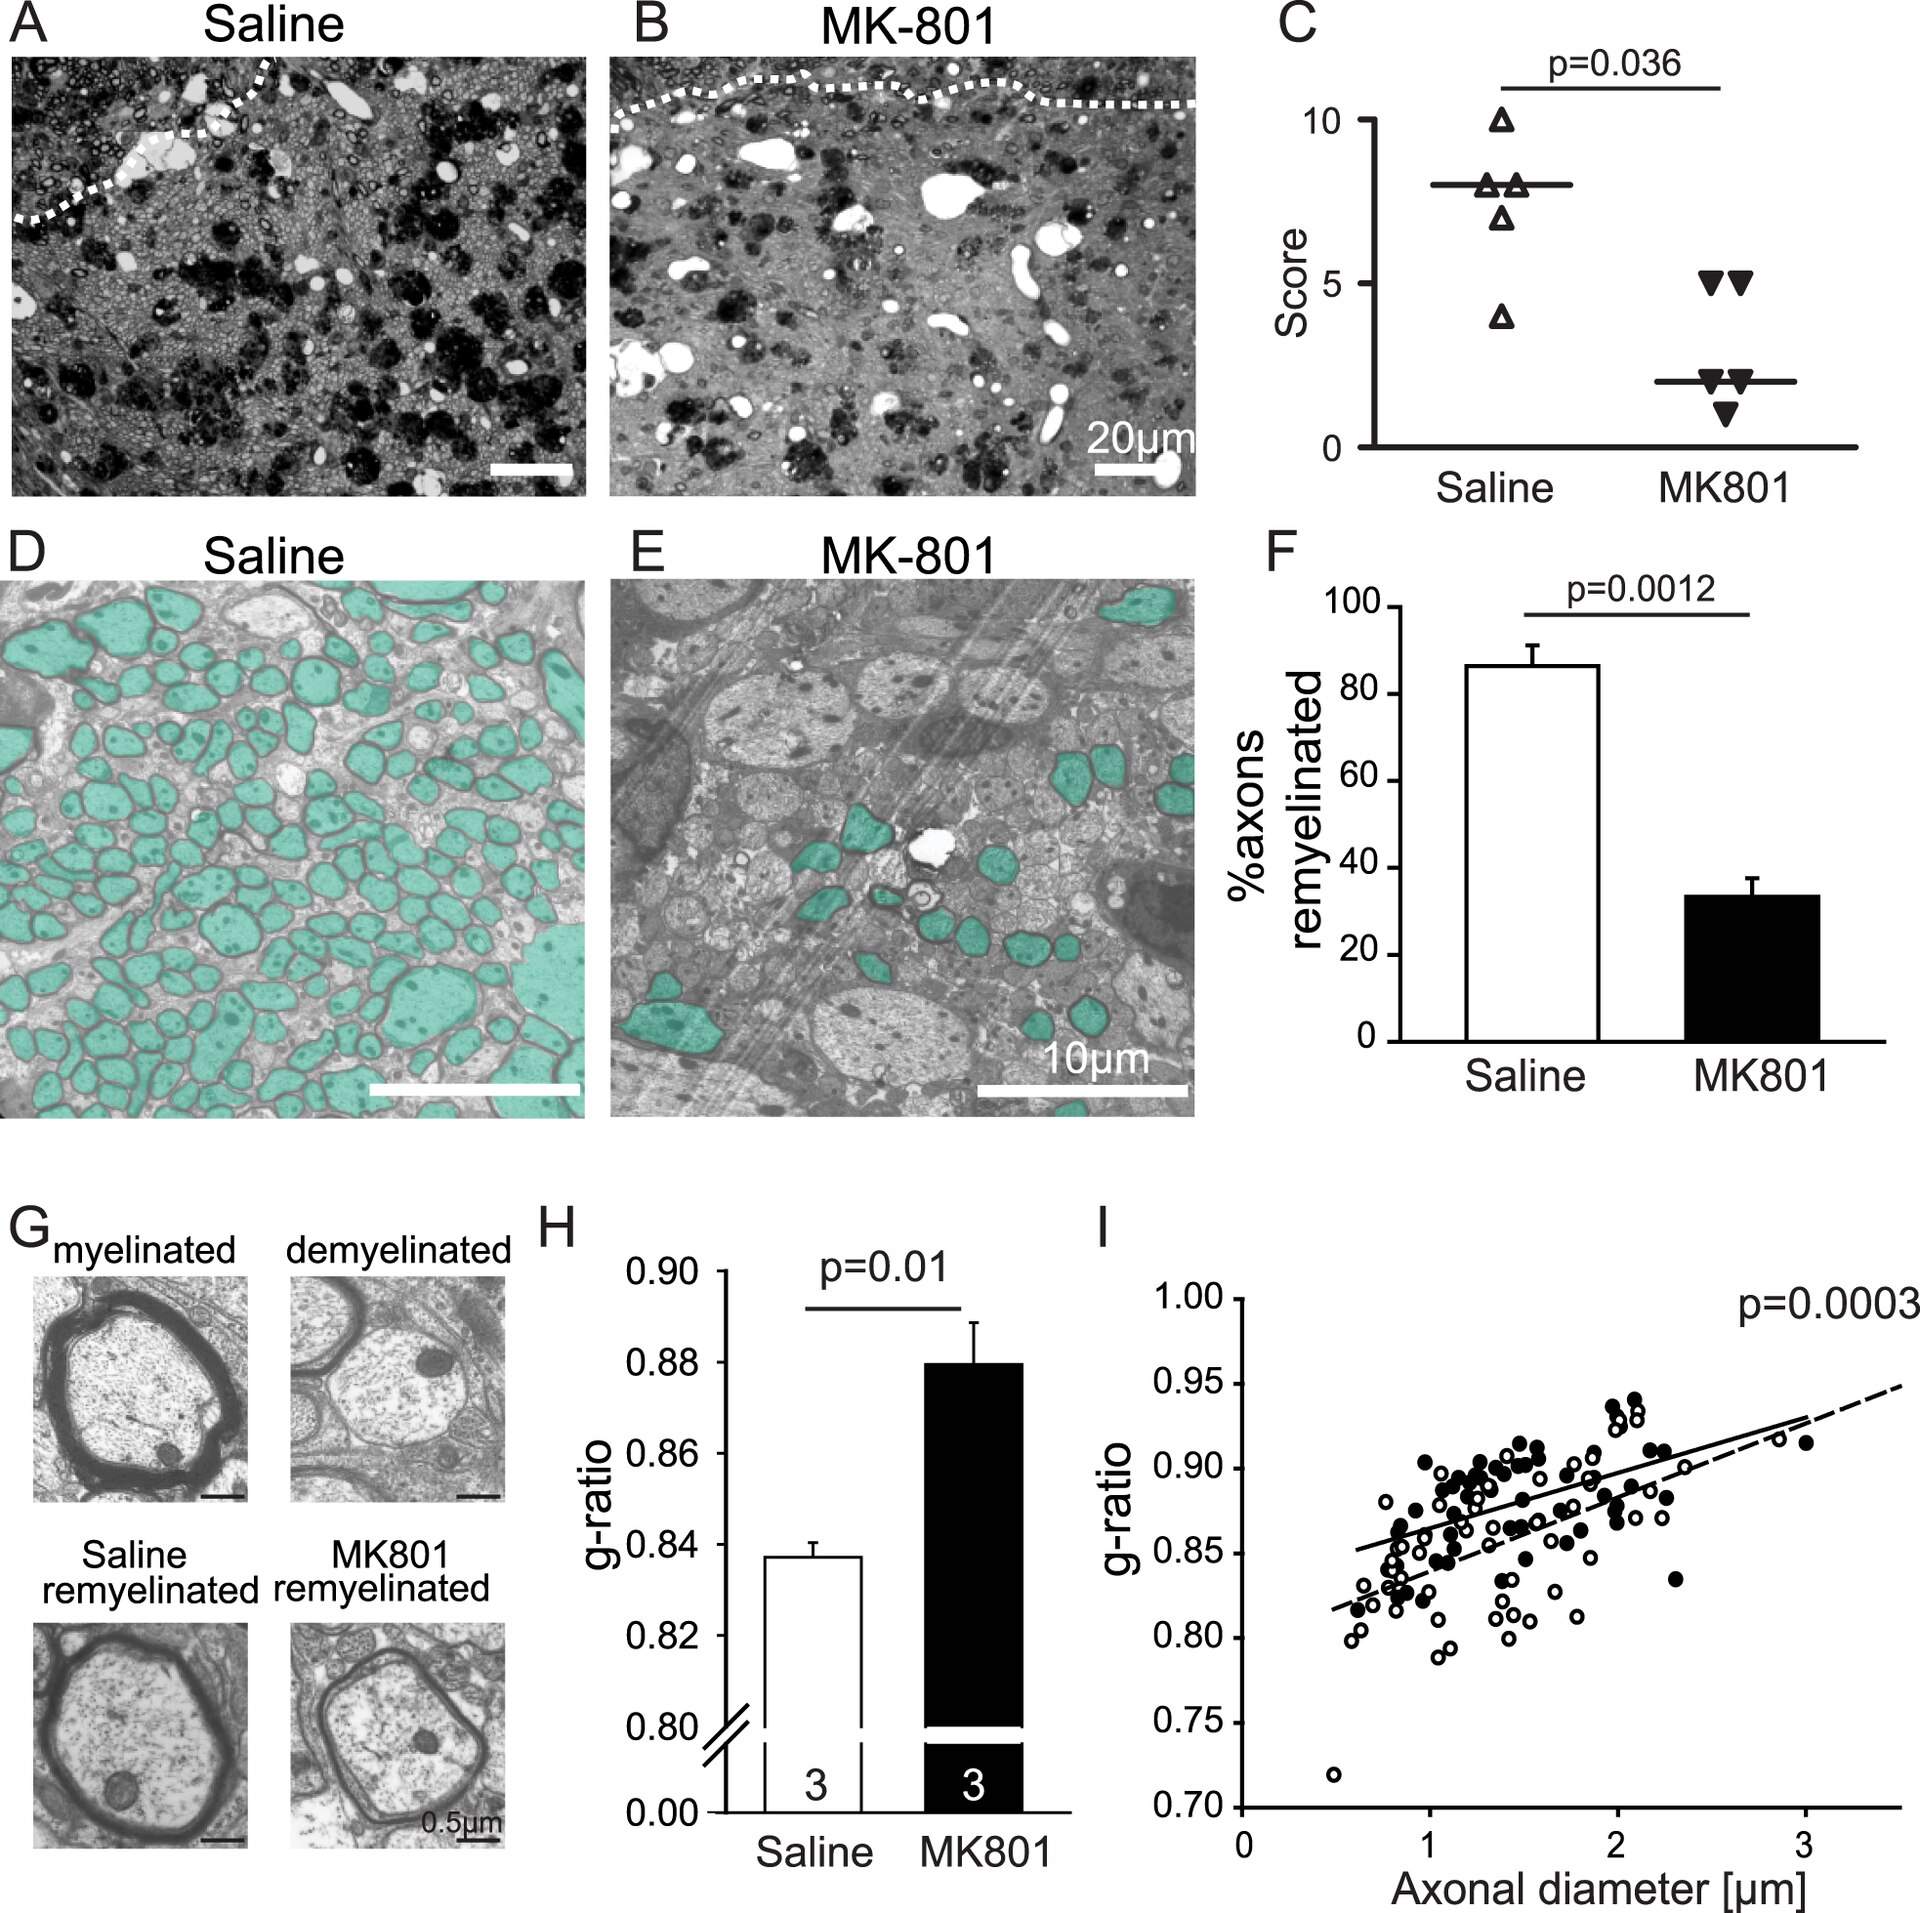
Semithin sections of lesioned cerebellar white matter showing that remyelination is dependent on NMDA receptor activation. Remyelinating axons show thin myelin sheaths characteristic of newly formed oligodendrocyte internodes.
Lundgaard I, Luzhynskaya A, Stockley JH, Wang Z, Evans KA, Sibson N et al. (Wikimedia Commons) · undefined · source
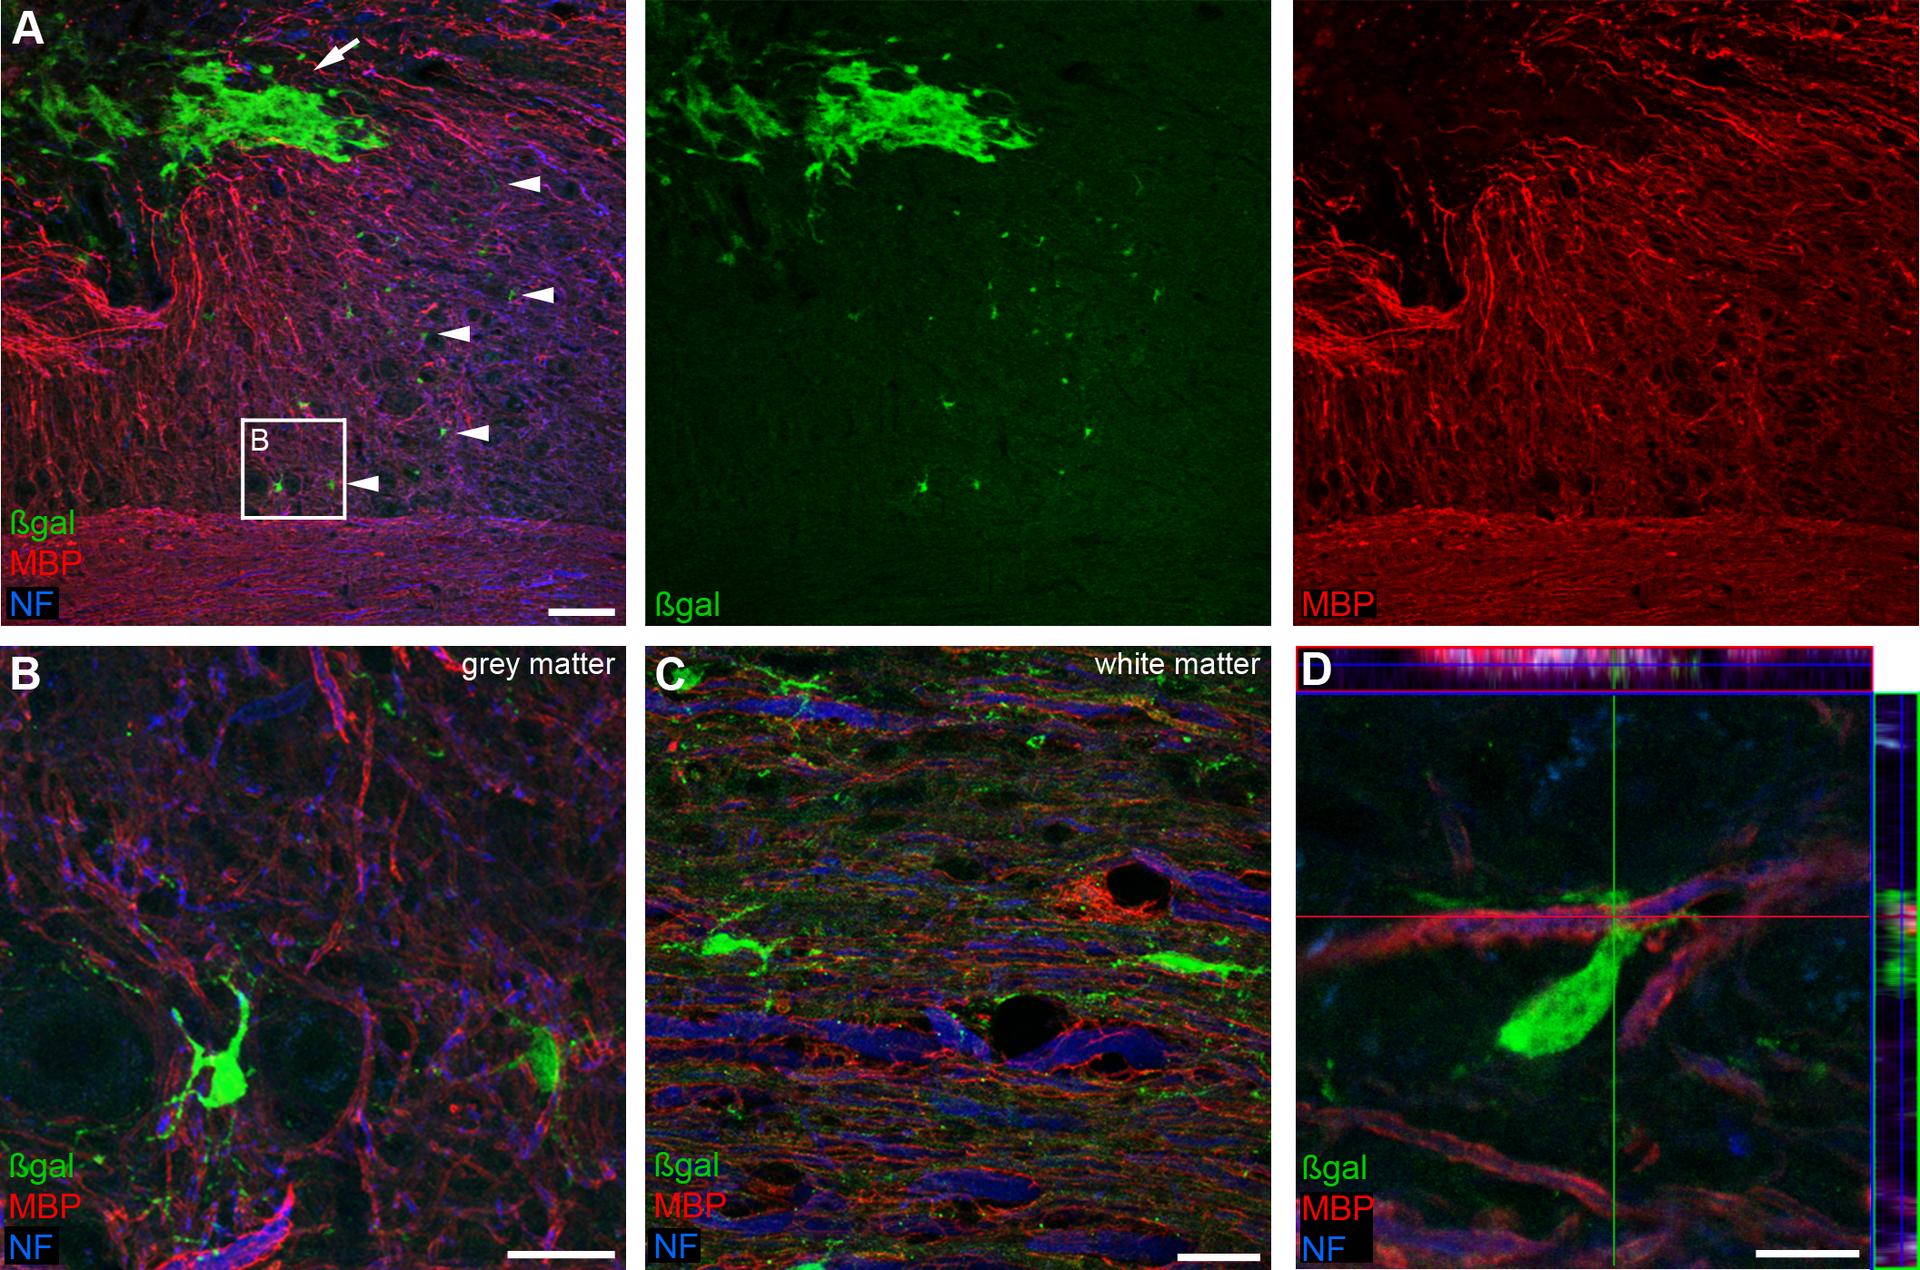
Ependymal cell-derived progeny after spinal cord injury. The image shows ependymal-derived cells immunoreactive for oligodendrocyte markers, demonstrating that ependymal cells can contribute oligodendrocytes to the injury response.
Meletis K, Barnabe-Heider F, Carlen M, Evergren E, Tomilin N et al. (Wikimedia Commons) · undefined · source
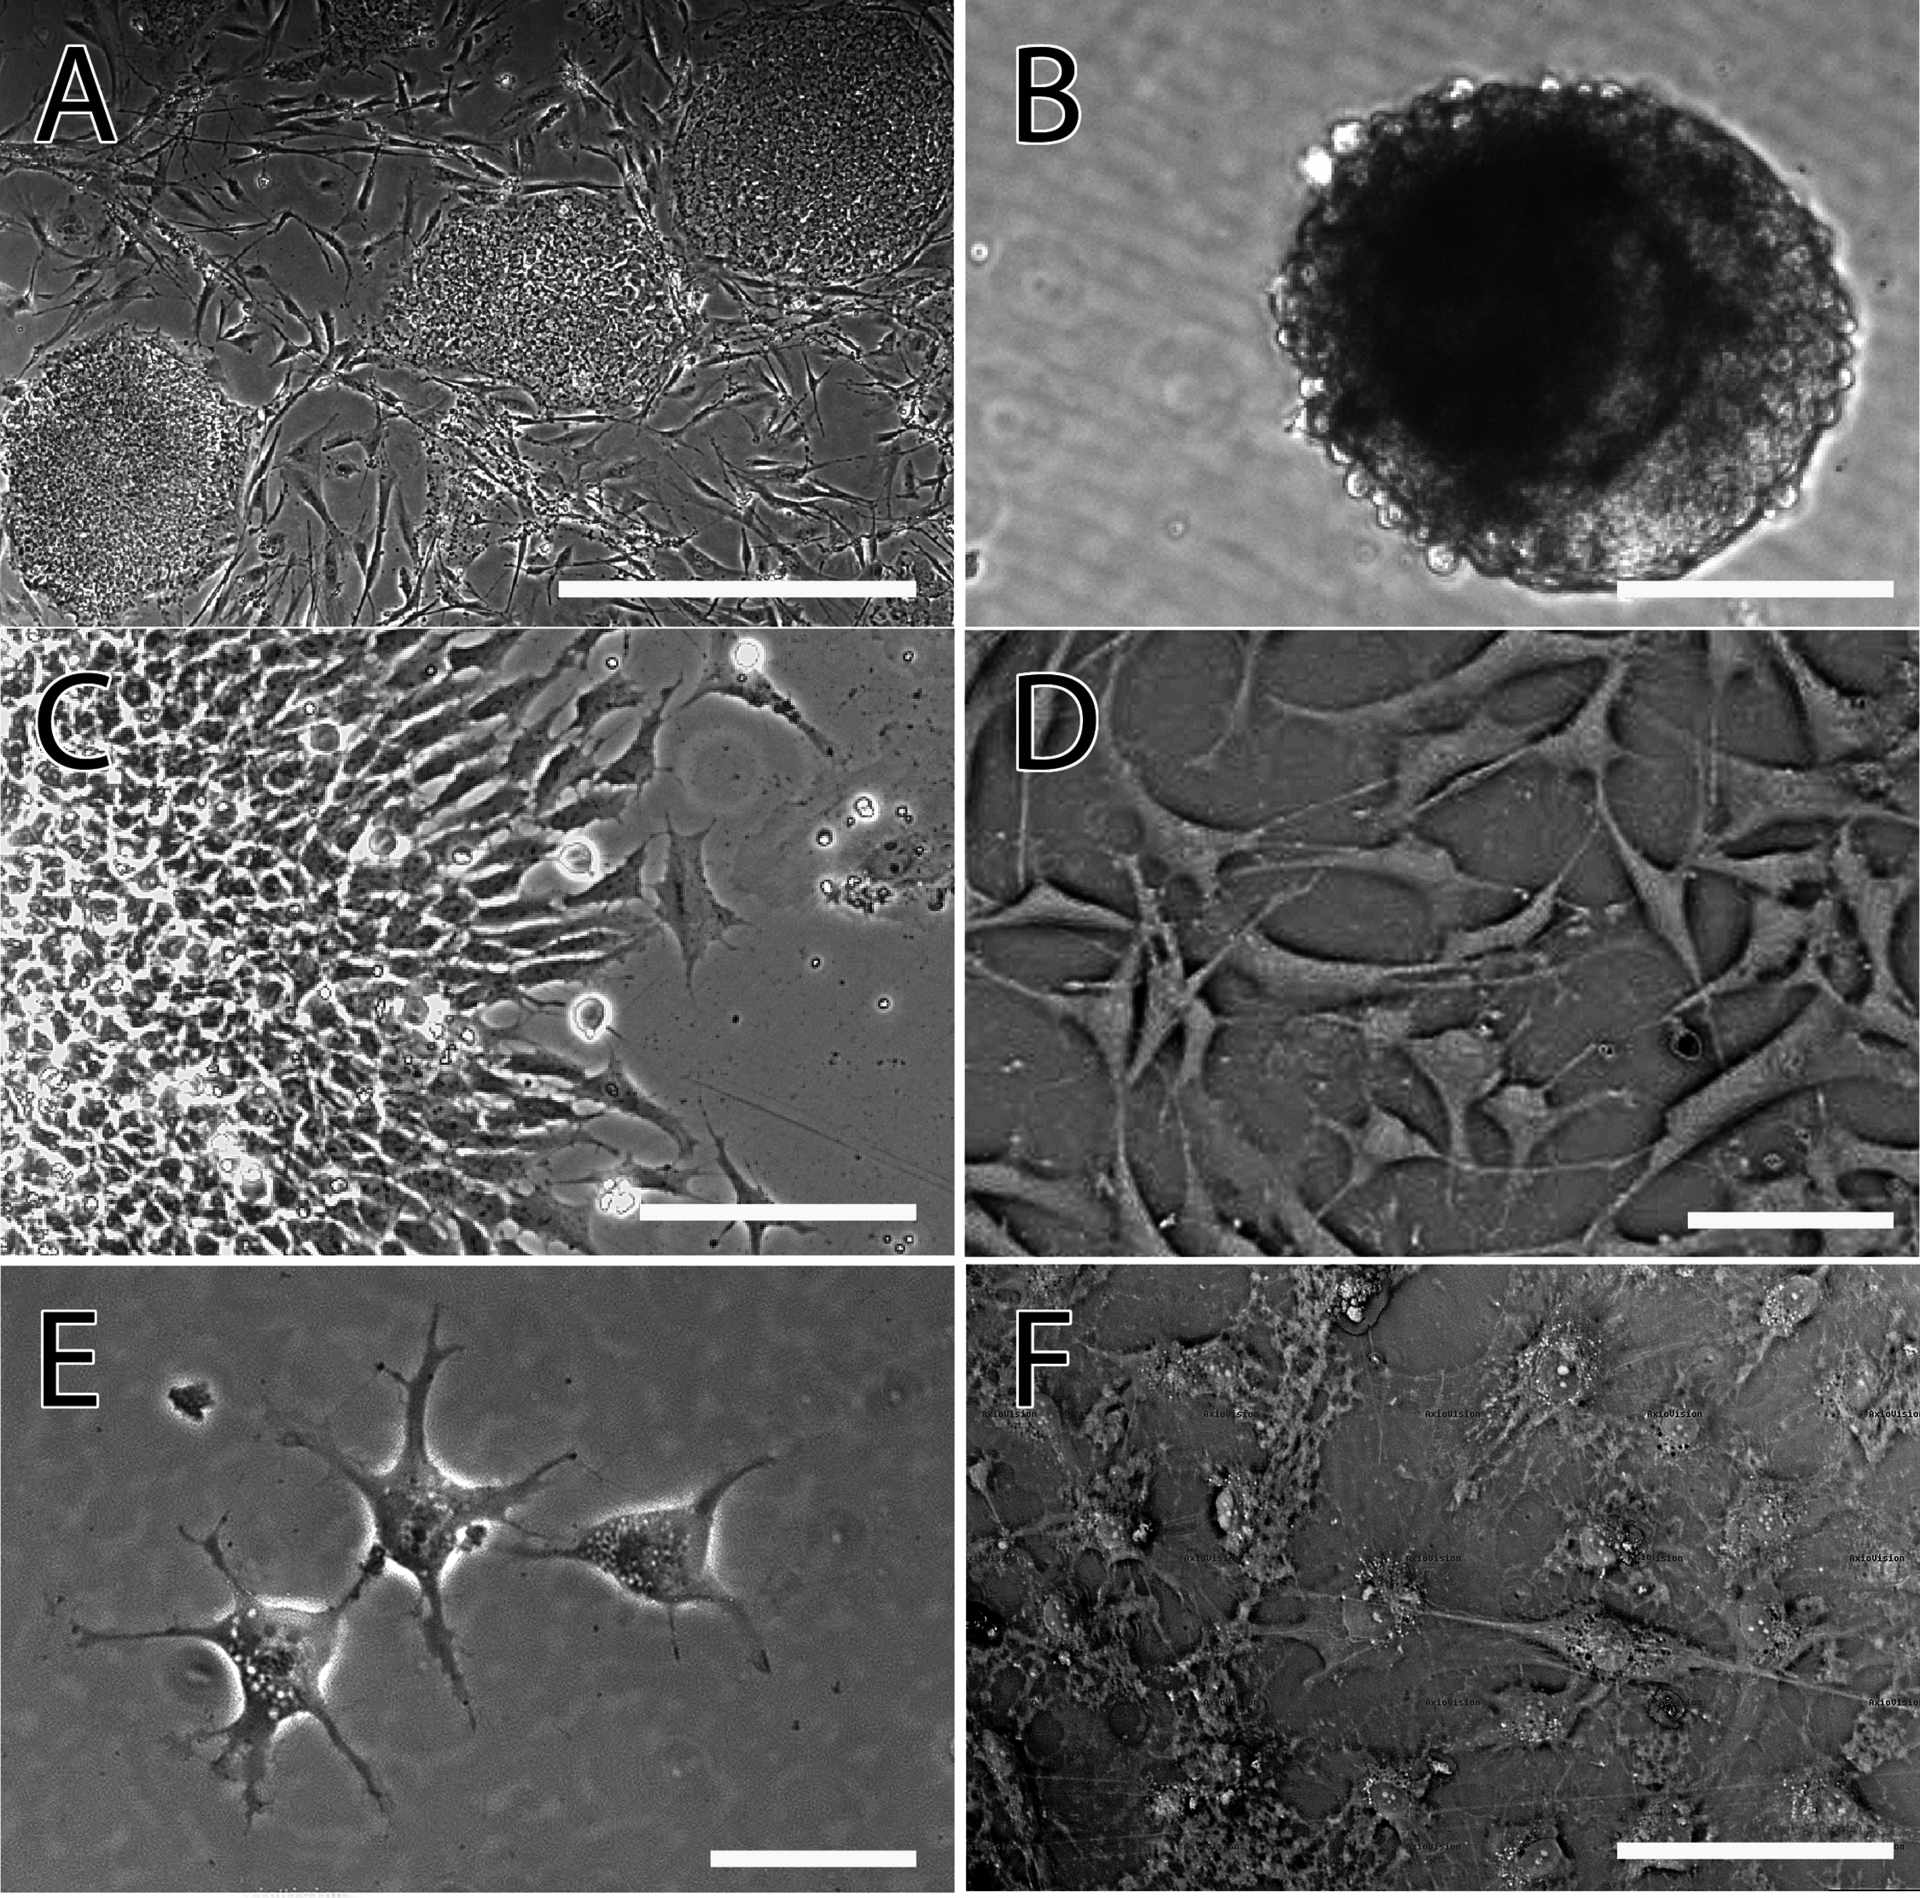
Bright field microscopy showing the stages of oligodendrocyte differentiation from human iPSCs (BC1 line). The progression from OPC to immature and then mature oligodendrocyte can be followed by the elaboration of processes and flattening of the cell body.
All AH, Gharibani P, Gupta S, Bazley FA, Pashai N, Chou BK et al. (Wikimedia Commons) · undefined · source
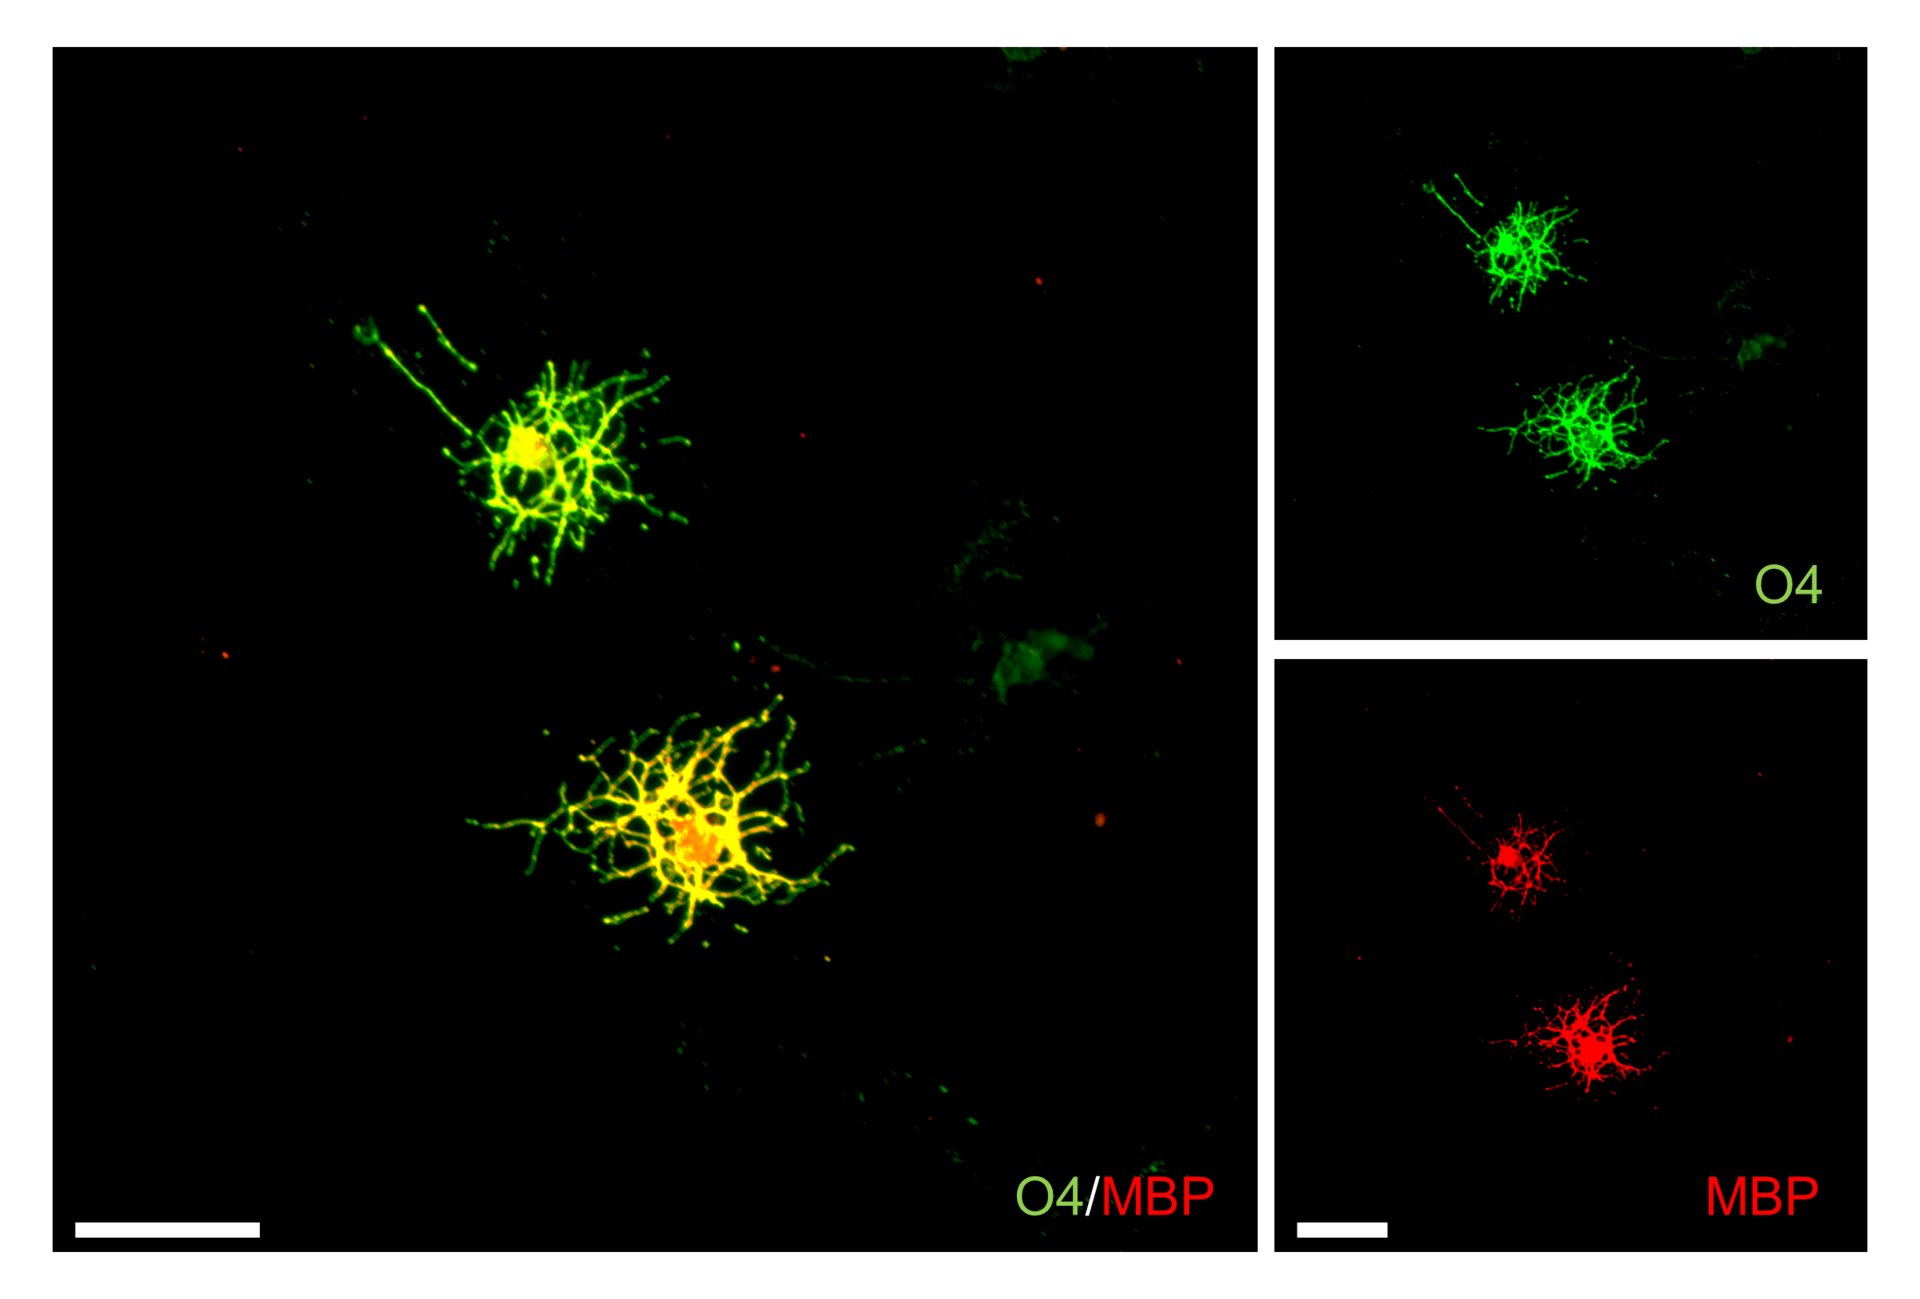
Immunofluorescence of oligodendrocytes differentiated from human iPSCs. O4 (green) marks the oligodendrocyte surface; MBP (red) marks myelin basic protein. The two markers co-localise in mature oligodendrocytes.
Yamashita T, Miyamoto Y, Bando Y, Ono T, Kobayashi S, Doi A et al. (Wikimedia Commons) · undefined · source
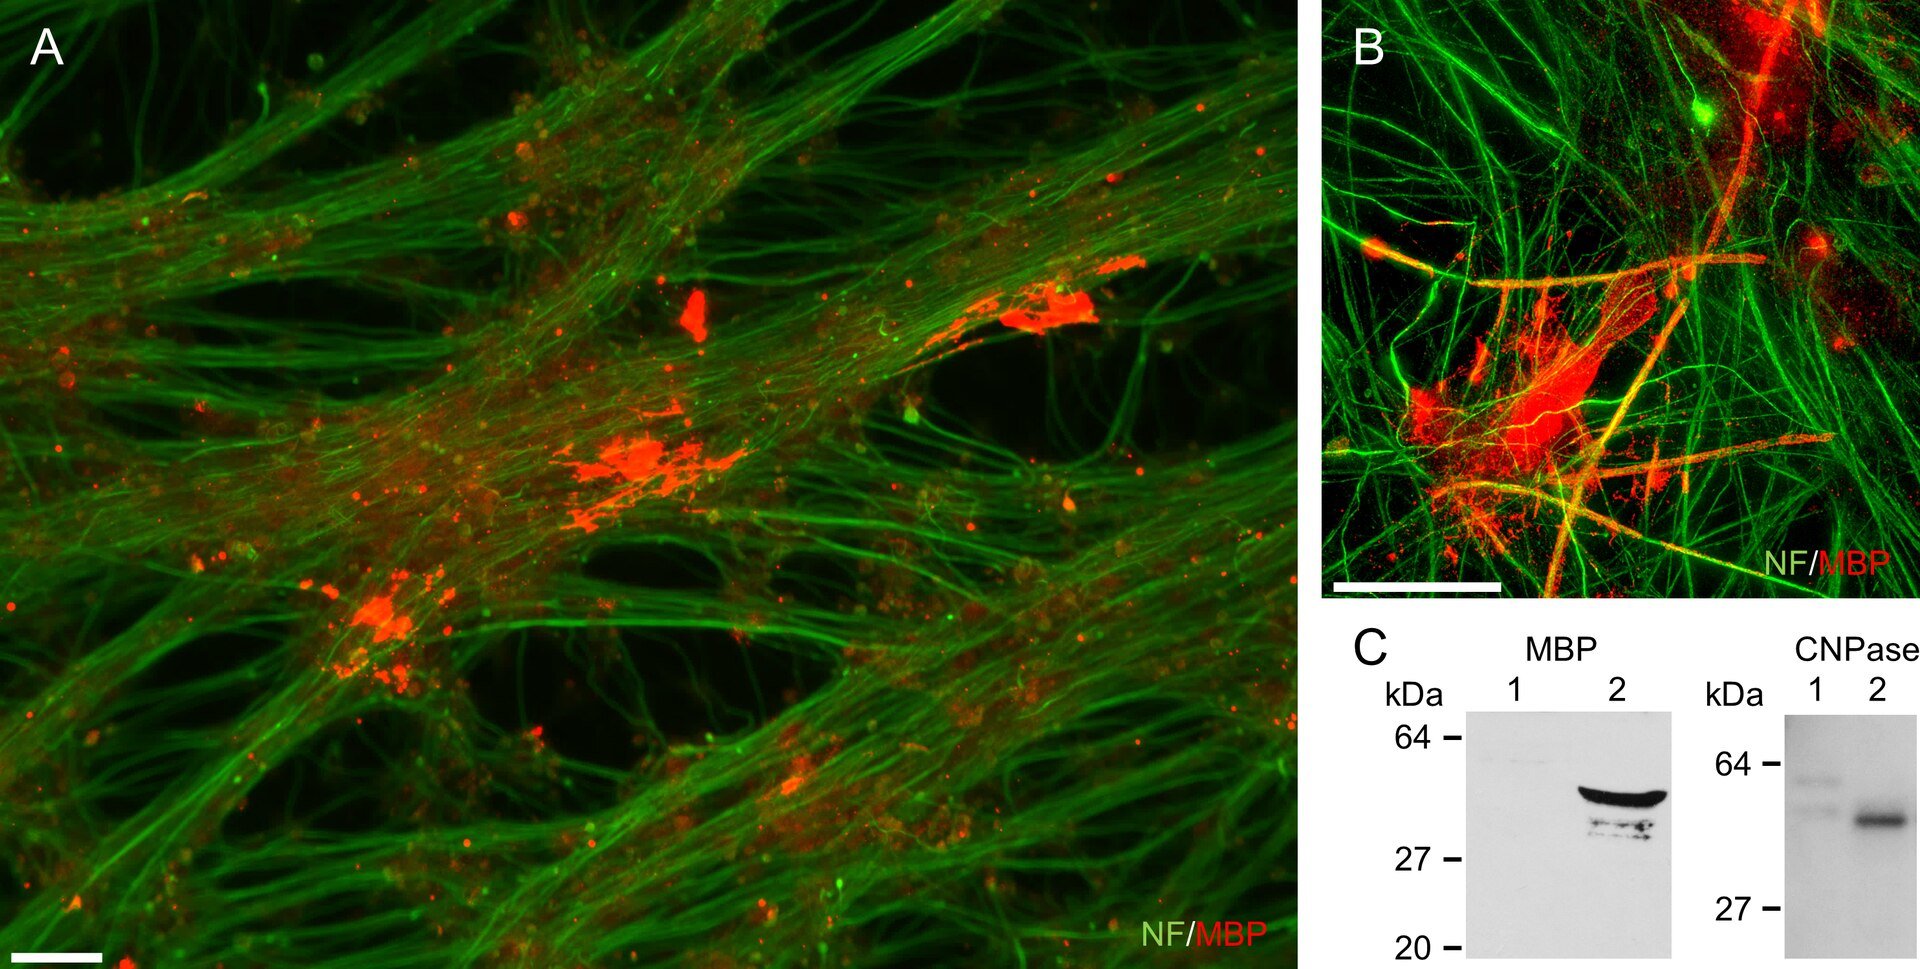
Monkey ESC-derived OPCs (CMK6SFF) co-cultured with rat DRG neurons demonstrate myelinogenic potency in vitro. MBP-positive (red) myelin segments wrap along axons.
Yamashita T, Miyamoto Y, Bando Y, Ono T, Kobayashi S, Doi A et al. (Wikimedia Commons) · undefined · source
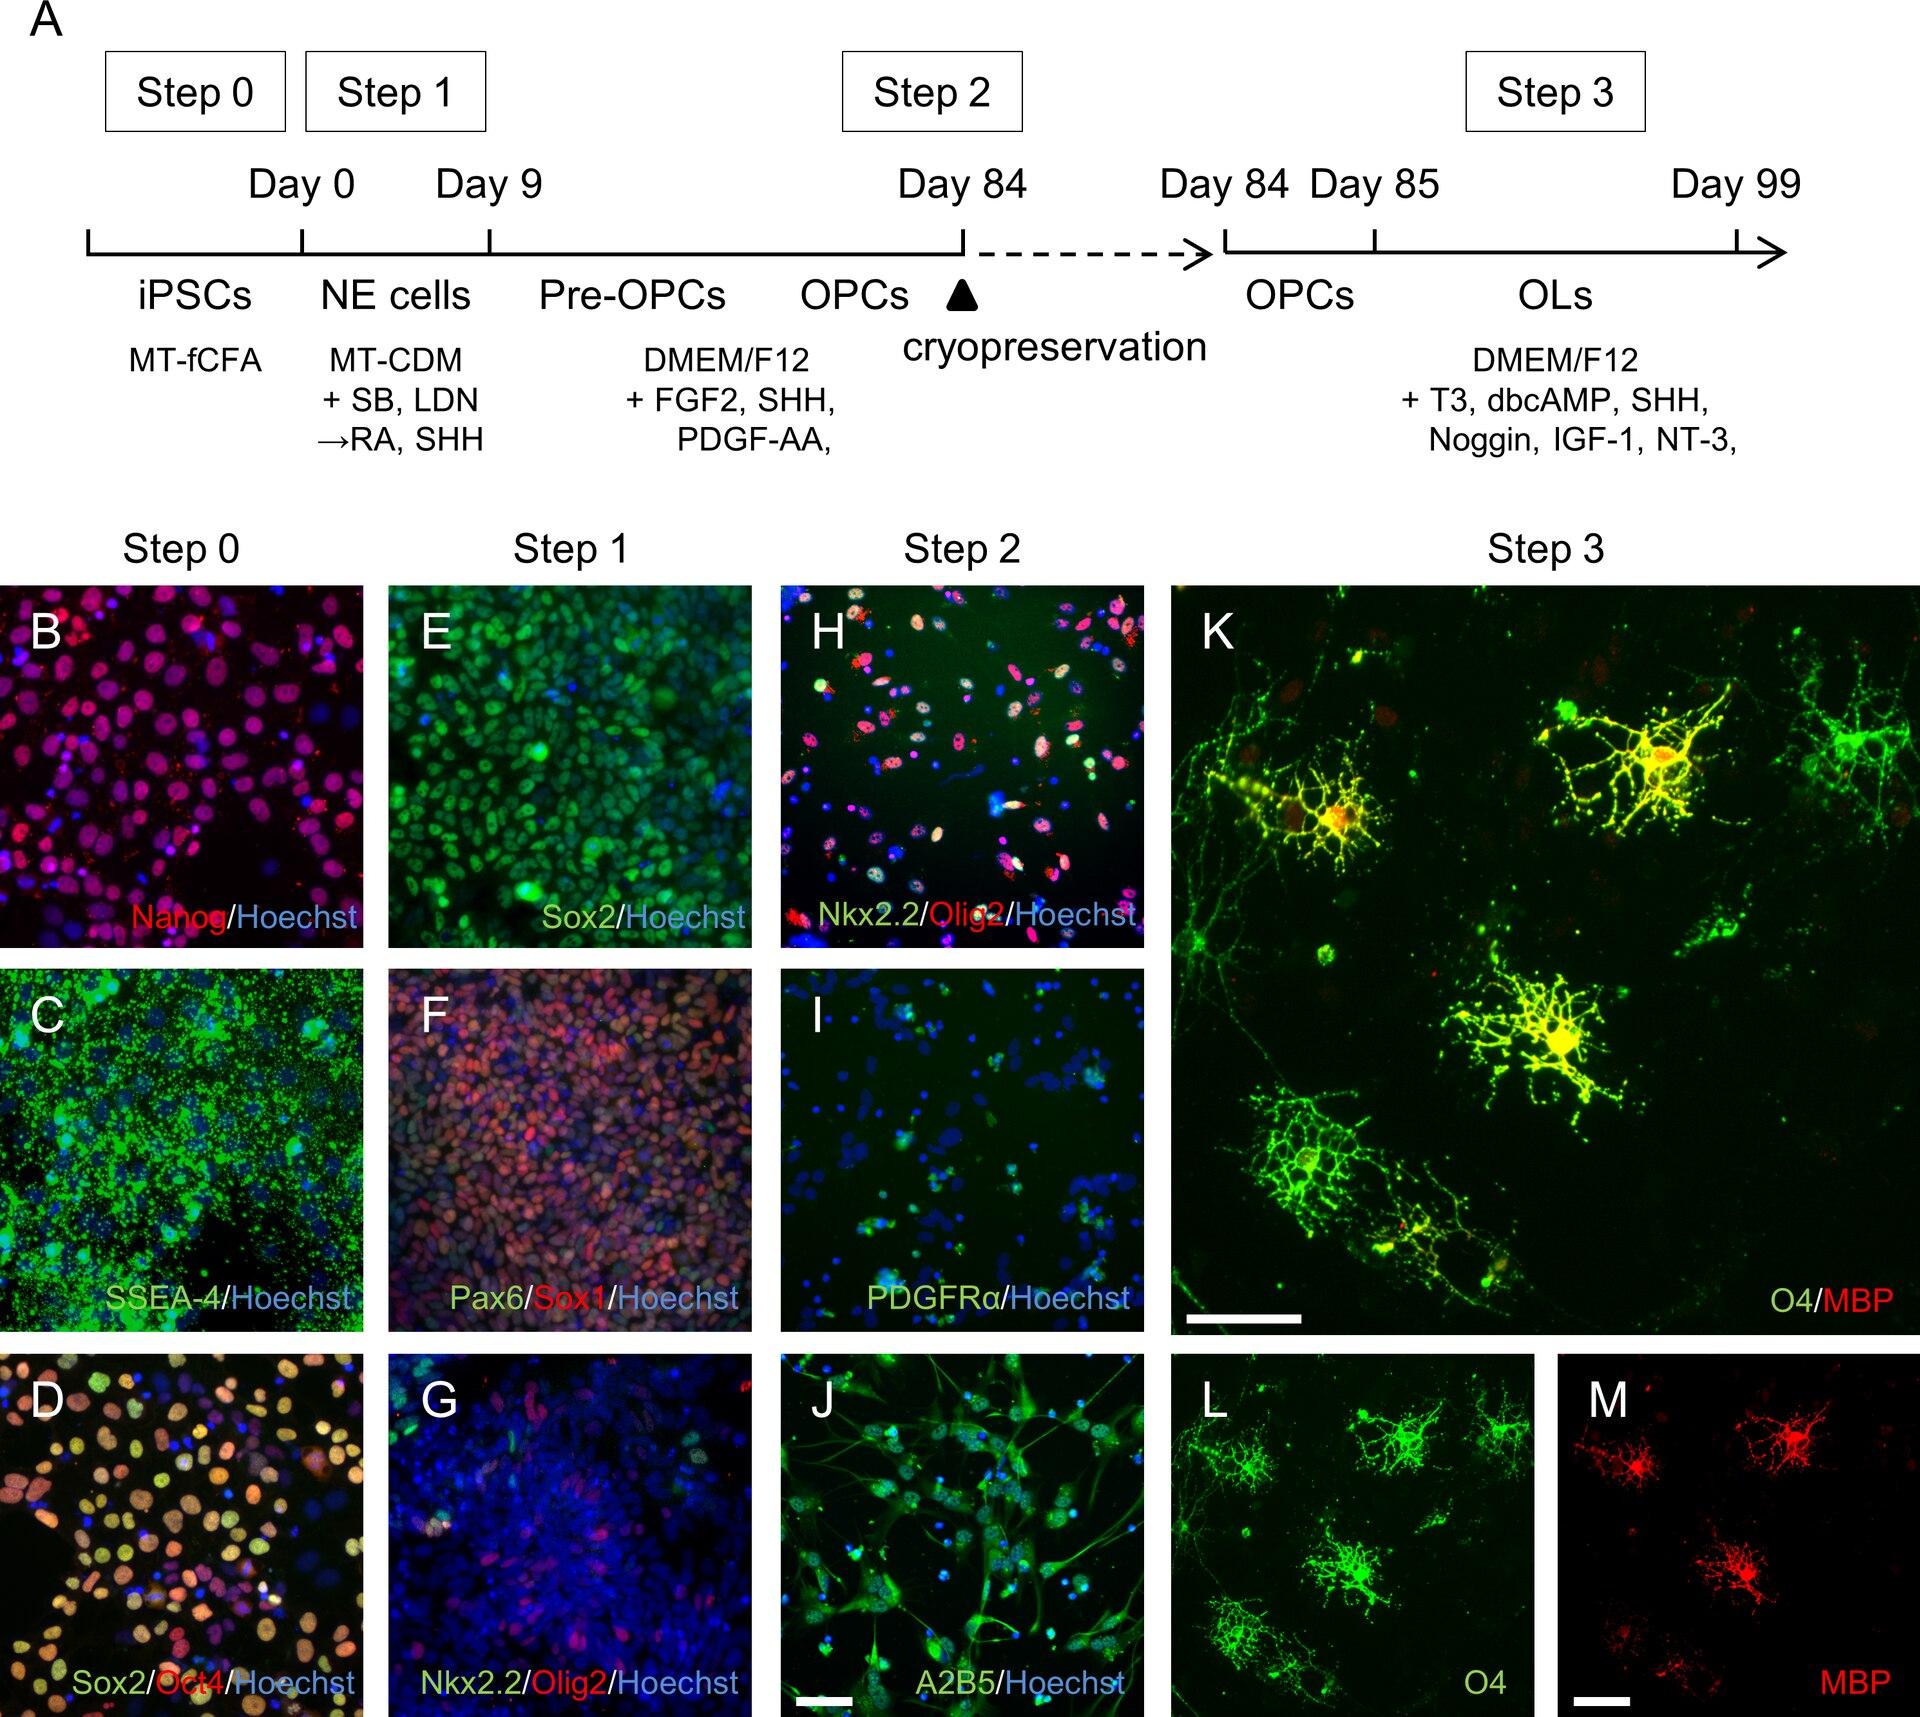
OPCs and oligodendrocytes differentiated from human iPSCs (A3 line). Fluorescence images show the differentiation protocol outcome and marker expression.
Yamashita T, Miyamoto Y, Bando Y, Ono T, Kobayashi S, Doi A et al. (Wikimedia Commons) · undefined · source
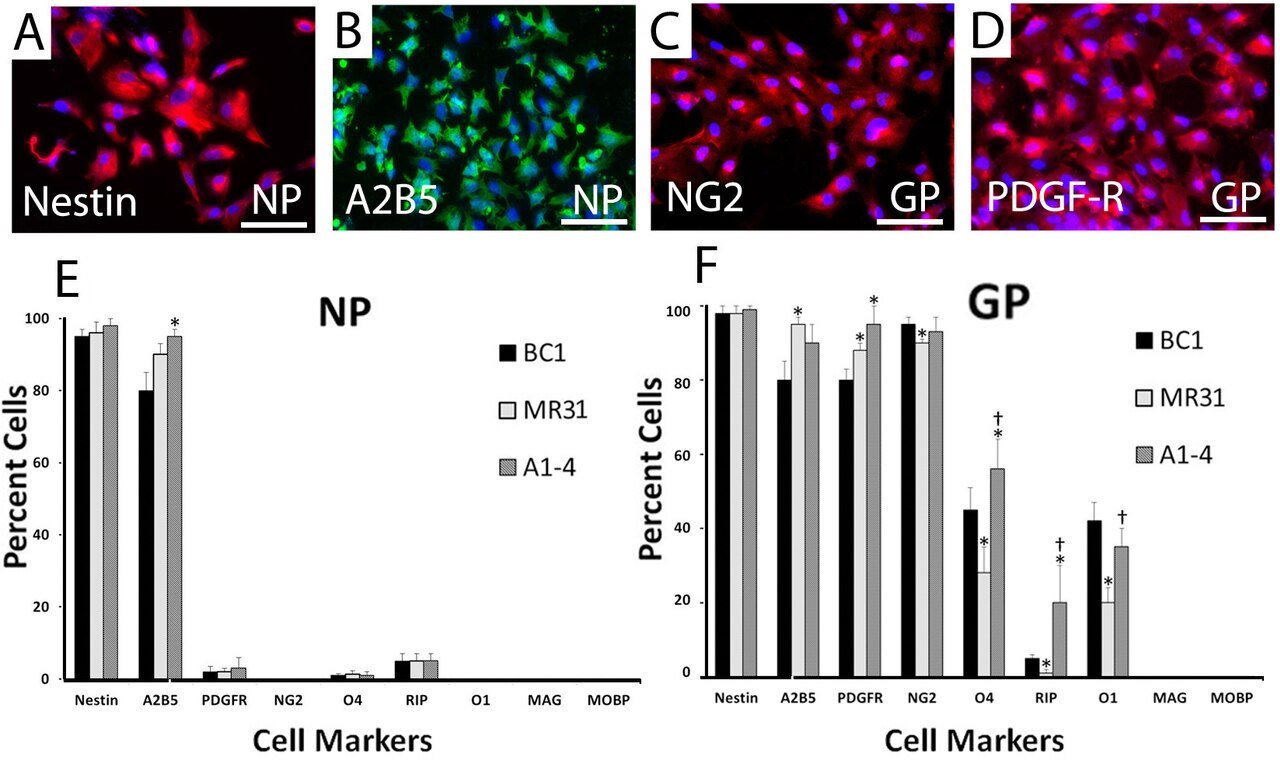
Indirect immunofluorescence defining the early stages of oligodendrocyte differentiation from iPSCs into neural progenitors (NP) and glial progenitors (GP).
All AH, Gharibani P, Gupta S, Bazley FA, Pashai N, Chou BK et al. (Wikimedia Commons) · undefined · source
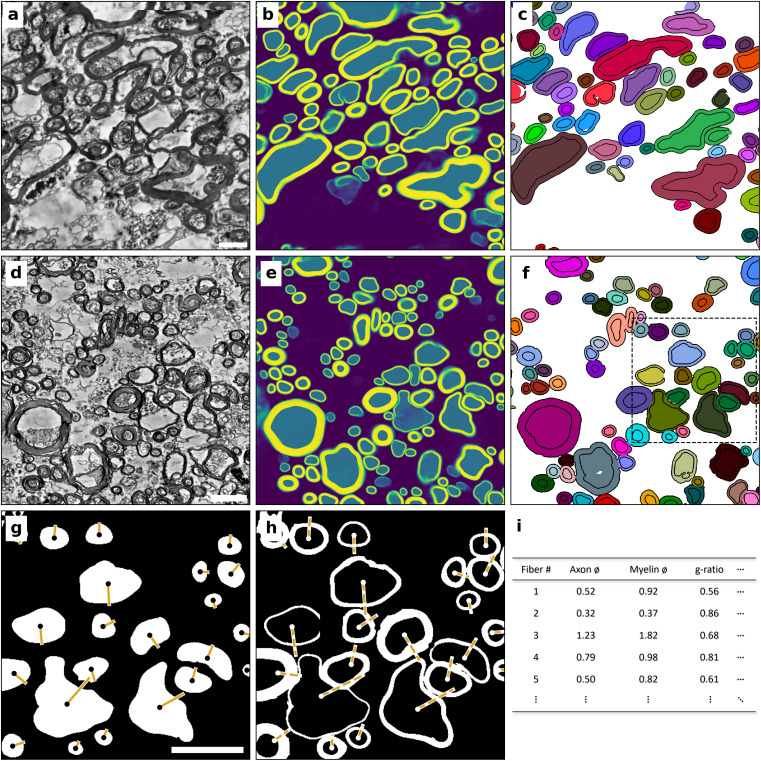
Overview of the segmentation approach for electron microscopic data. a, Preprocessed transmission electron microscopic data of human corpus callosum (CC). b, Semantic prediction of the preprocessed data by the trained DenseNet, returning a likelihood of each pixel to belong to either background (violet), axon (teal), or myelin (yellow). c, Post-processed final segmentation. Each instance of a fiber (axon and myelin sheath) is labelled with a different random color. d–f, Analogous to a–c, with transmission electron microscopic data of human superficial white matter (SWM). The dashed region in f is shown in g,h. The measurement of axon (g) and myelination (h) diameters is based on ellipses fitted to each structure. Points show the centroid of each structure, axes show half of the minor axis of the fitted ellipse for the axon (solid line) and myelin (dashed line). i, Measurements (SWM: n = 220,431, CC: n = 163,133) from g, h are used for statistical assessment of local ultrastructure. We treat the short axis (half of which is shown in yellow in g, h) of the fitted ellipse as the actual diameter of each structure. All scale bars are 2 µm.
Ruthig, von der Planitz, Morozova et al 2025, PLOS Biology · undefined · source
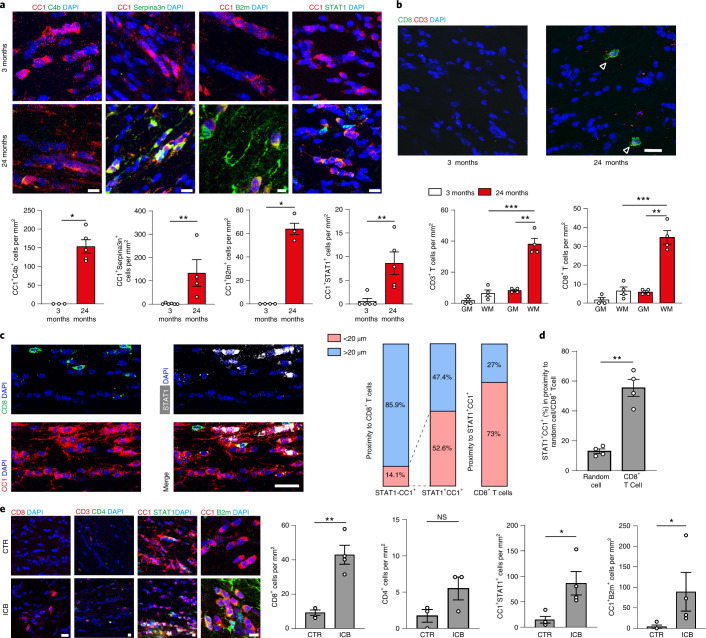
IFN-responsive oligodendrocytes localize to aged white matter close to CD8+ T cells. a, Immunofluorescence staining and quantification of C4b, Serpina3n, B2m and STAT1 in CC1+ oligodendrocytes in the white matter of 3- and 24-month-old mice (C4b+CC1+, 3-month, n = 3, 24-month, n = 5; Serpina3n+CC1+, 3-month, n = 6, 24-month, n = 4; B2m+CC1+, 3-month, n = 4, 24-month, n = 4; STAT1+CC1+, 3-month, n = 5, 24-month, n = 5; data are mean ± s.e.m.). Scale bar, 20 µm; for B2m, 10 µm.
Kaya, Mattugini, Liu et al 2022, Nature Neuroscience · undefined · source
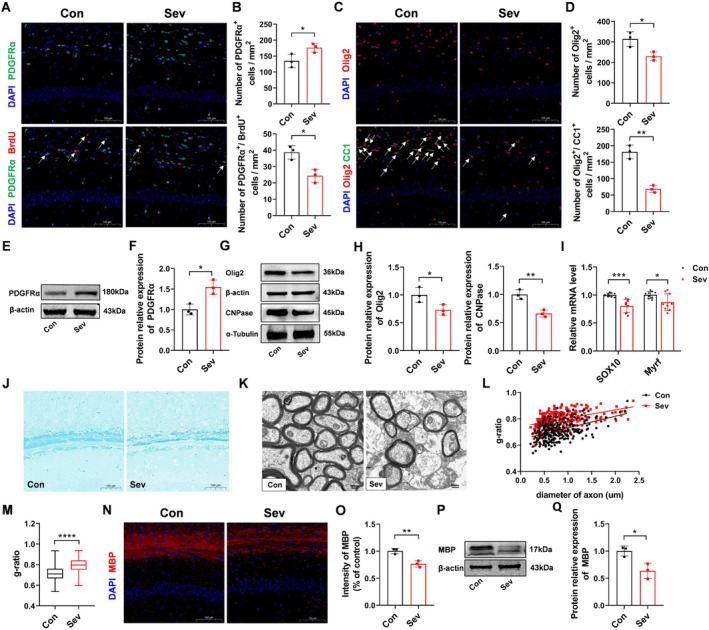
Effects of repeated sevoflurane exposure on OPC proliferation, differentiation, and myelination in neonatal mice. (A) IF staining of PDGFRα (green) and BrdU (red) in the hippocampal CA1 region. Colocalized cells (yellow) are indicated by white arrows, and nuclei were counterstained with DAPI (blue) (scale bar = 100 μm). (B) Quantitative analysis of PDGFRα+ cells and PDGFRα+/BrdU+ double-positive cells; n = 3 mice/group. (C) IF staining of Olig2 (red) and CC1 (green) in the hippocampal CA1 region. Colocalized cells (yellow) are indicated by white arrows, and nuclei were counterstained with DAPI (blue) (scale bar = 100 μm). (D) Quantitative analysis of Olig2+ cells and Olig2+/CC1+ double-positive cells; n = 3 mice/group. (E) WB analysis of PDGFRα protein expression in hippocampal tissue. (F) Quantitative analysis of PDGFRα protein band intensity; n = 3 mice/group. (G) WB analysis of Olig2 and CNPase protein expression in hippocampal tissue.
Liu, Bai, Liu et al 2026, CNS Neuroscience & Therapeutics · undefined · source
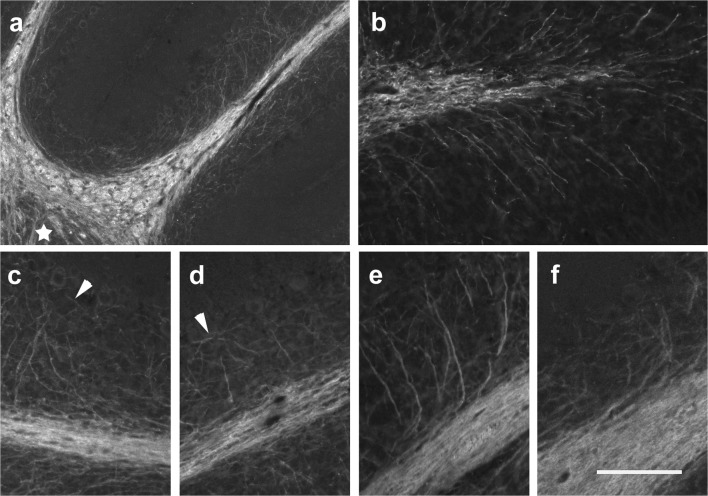
MBP immunoreactivity in the p15 and p28 cerebellum. a–d The p15 cerebellum is characterized by intensive immunoreactivity for MBP throughout the WM. The density of MBP-positive fibers also increased within the DCN (star in a) and the IGL of all lobules. In the proximal parts of the lobules, MBP-positive fibers are found almost up to the PCL (a, c). Distally, MBP-positive fibers do not yet reach the PCL (b, d). At the tips of the lobular WM, MBP-positive fibers branch radially in all directions (b). Arrowheads in c and d point out MBP-positive fibers running more or less parallel to the PCL. e, f In the p28 cerebellum, many MBP-positive fibers ascend through the IGL up to the PCL. Whereas they emanate at flat angles from the white matter in proximal parts of the lobules (e), more distally,
Groteklaes, Bönisch, Eiberger et al 2020, Cerebellum (London, England) · undefined · source
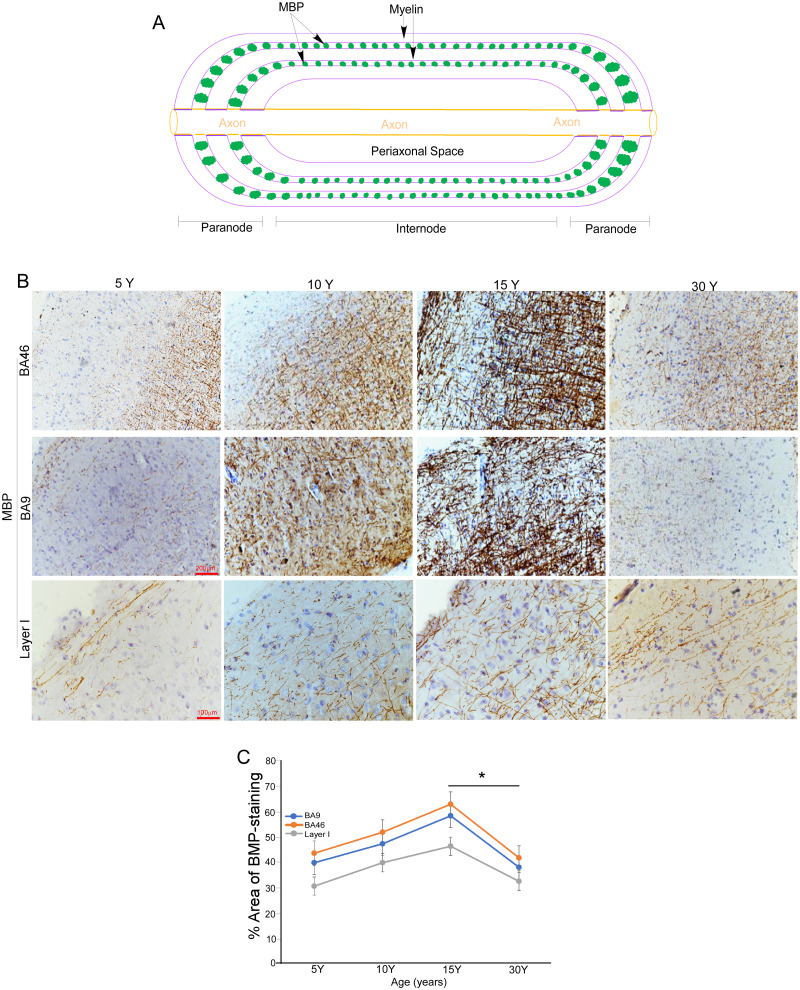
Age-related changes in the intensity of MBP signals in the macaque brain. A, Schematic diagram illustrates the role of MBP in maintaining myelin sheath integrity. B, Representative images of immunohistochemistry (IHC) showing MBP signals (brown) in Brodmann areas BA46 and BA9, as well as layer 1 of the prefrontal cortex (PFC) in macaques at ages 5, 10, 15, and 30 years. Scale bar as indicated. C, Relative intensities of IHC MBP signals shown in panel B were quantified using ImageJ. Data are presented as mean ± SD (n = 5 macaques per age group; * p = 0.0038, unpaired t test).
Zhang, Yao, Lv et al 2026, eNeuro · undefined · source
![Prophylactic OM-MOG prevents the development of spinal cord neuropathology during MOG-EAE in DR2b.Ab° mice. Neuropathological analysis of spinal cord sections from prophylactic vehicle- (upper and middle panels) and OM-MOG-injected (lower panels) DR2b.Ab° mice on day 36 post-immunization for EAE. Inflammatory cell infiltration was visualized by H&E (A, D); demyelination by Luxol fast blue [(B) and enlarged inset, (E)]; axon damage by Bielschowsky's silver staining [(C) and enlarged inset, (F)]. Vehicle-treated mice show large confluent inflammatory, demyelinating lesions with axon damage typical of MOG-EAE (arrowheads). OM-MOG-vaccinated mice showed no spinal cord pathology. Scale bars 500 μM (A–F), 100 μM enlarged inserts in middle panels.](/images/oligodendro/luxol-fast-blue.jpg)
Prophylactic OM-MOG prevents the development of spinal cord neuropathology during MOG-EAE in DR2b.Ab° mice. Neuropathological analysis of spinal cord sections from prophylactic vehicle- (upper and middle panels) and OM-MOG-injected (lower panels) DR2b.Ab° mice on day 36 post-immunization for EAE. Inflammatory cell infiltration was visualized by H&E (A, D); demyelination by Luxol fast blue [(B) and enlarged inset, (E)]; axon damage by Bielschowsky's silver staining [(C) and enlarged inset, (F)]. Vehicle-treated mice show large confluent inflammatory, demyelinating lesions with axon damage typical of MOG-EAE (arrowheads). OM-MOG-vaccinated mice showed no spinal cord pathology. Scale bars 500 μM (A–F), 100 μM enlarged inserts in middle panels.
Dagkonaki, Avloniti, Evangelidou et al 2020, Frontiers in Immunology · undefined · source
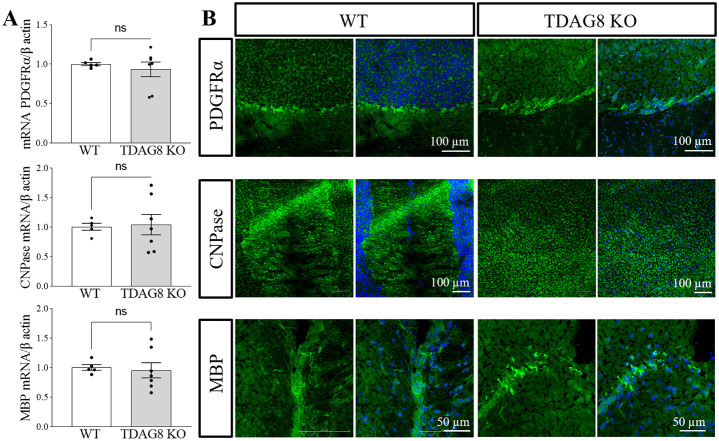
TDAG8 deficiency does not affect normal myelination in the mouse brain. A. The mRNA analysis of pdgfrα, cnpase and mbp expression in whole brain homogenates did not reveal differences between the TDAG8 KO and WT mice. B. Representative images of immunohistochemically stained WT and TDAG8 KO mice brains (cerebellum) show no differences in myelination between the two genotypes.
Caratis, Opiełka, Hausmann et al 2024, PLOS ONE · undefined · source
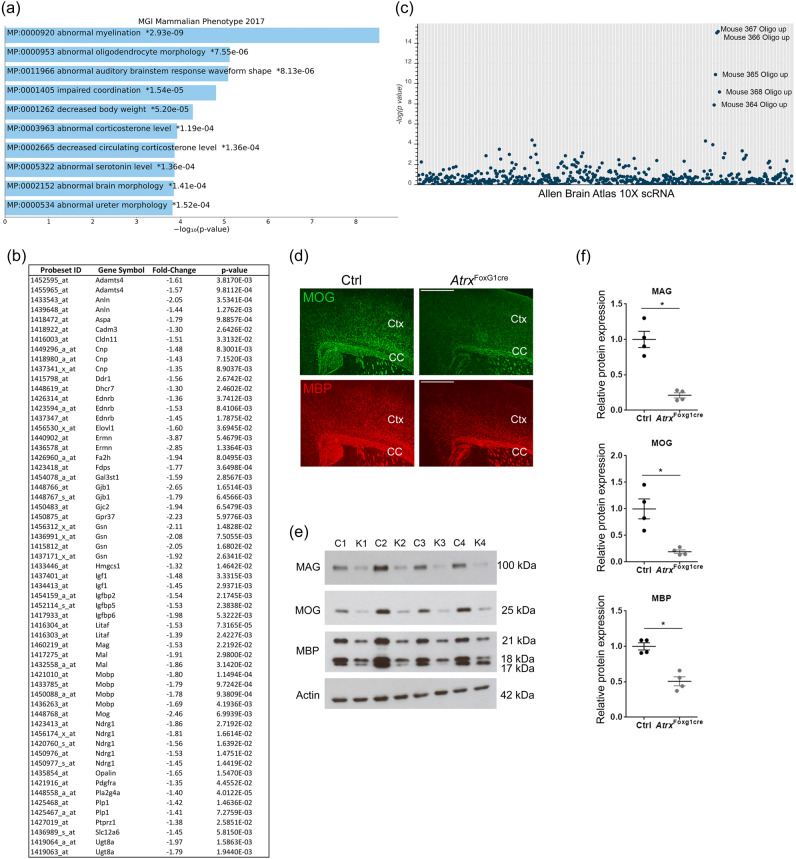
Defective myelination in the ATRX-null mouse forebrain. d Immunofluorescence microscopy of P20 brain cryosections stained with anti-MOG (green) and anti-MBP (red) antibodies confirms decreased levels of these myelin proteins in the cortex (Ctx) and corpus callosum (CC) of the forebrain of AtrxFoxG1Cre mice compared to controls (Ctrl) (n = 3 animals for each genotype).
Rowland, Jiang, Shafiq et al 2023, Nature Communications · undefined · source
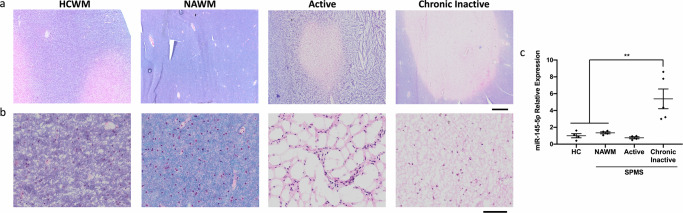
miR-145-5p is upregulated in chronic lesion tissue from SPMS brains. a, b Luxol fast blue/hematoxylin and eosin stained human brain tissue from healthy control white matter (HCWM), and normal appearing white matter (NAWM), active and chronic inactive lesion tissue from SPMS brain. a Scale bar = 1 mm. b Magnified from (a); scale bar = 50 µm.
Kornfeld, Cummings, Yaworski et al 2024, Communications Biology · undefined · source
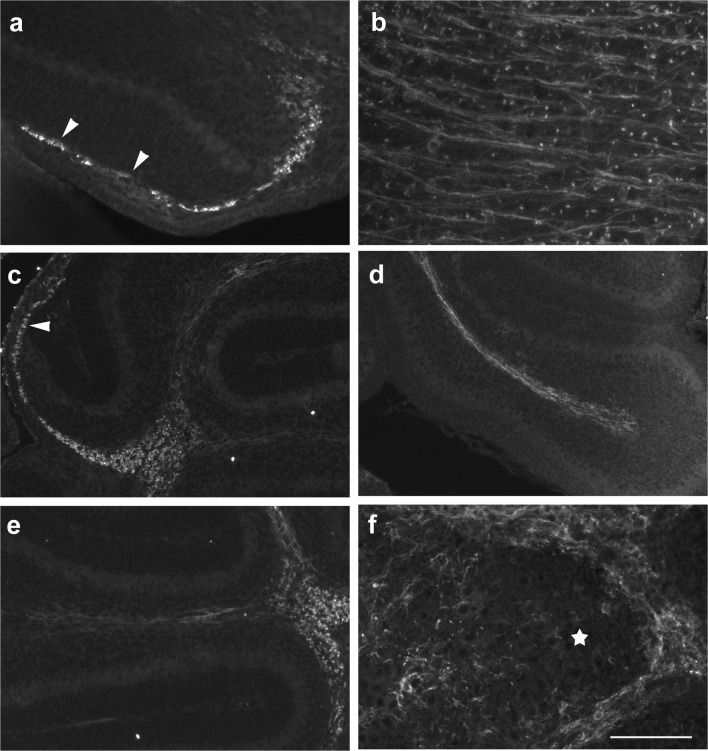
CNP-1 immunoreactivity in the early postnatal mouse cerebellum (p0–p6). a CNP-1-positive cells in the p4 cerebellar anlage are roundish and may be found in the velum medullare (arrowheads in a) and the anteriormost parts of the cerebellar anlage. Sagittal section close to the midline; anterior is to the left. b In the brainstem, CNP-1-positive structures have a fibrous morphology at this age. c, d CNP-1-positive cells at p6. Immunoreactive cells can again be detected in the velum medullare (arrowhead in c). They can now also be seen in the nascent central WM and the nascent WM extending into t
Groteklaes, Bönisch, Eiberger et al 2020, Cerebellum (London, England) · undefined · source
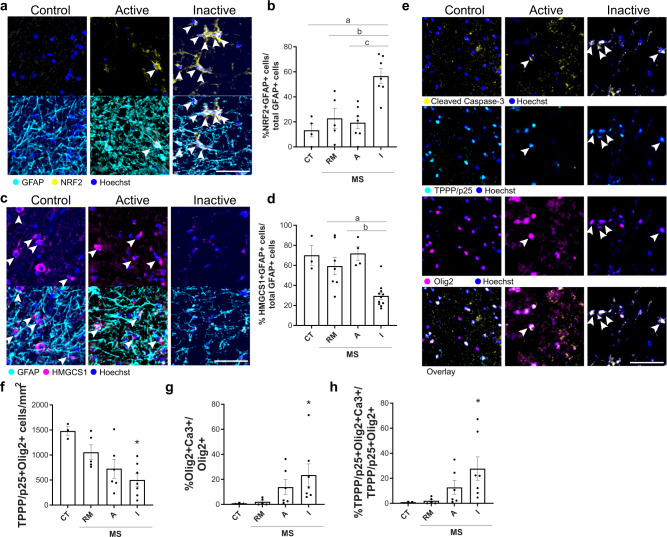
Astrocytic Nrf2 and cholesterol pathways are altered in chronic human brain lesions with poor remyelination potential and oligodendrocyte death. a Nrf2+ (yellow) astrocytes (GFAP+; cyan) (arrows) with Hoechst in blue. Scale bar, 100 μm. e Active caspase-3+ (yellow) oligodendrocytes (TPPP/p25+; cyan, and Olig2+; magenta) (arrows) in control (CT), remyelinated (RM), active (A) and inactive lesions (I) from multiple sclerosis (MS) cases.
Molina-Gonzalez, Holloway, Jiwaji et al 2023, Nature Communications · undefined · source
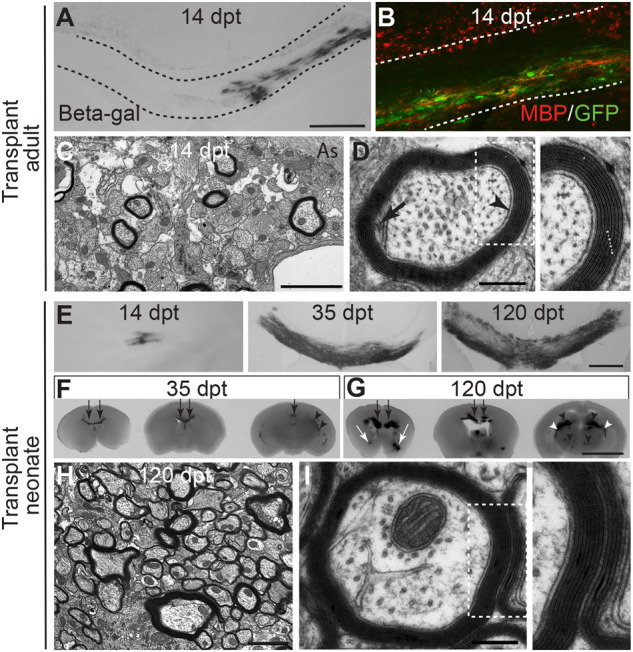
Neural precursors form compact myelin sheaths after transplantation into adult or neonatal Plp1-tg mice. ( A ) Light microscopy image of beta galactosidase-positive cells in the corpus callosum (delineated) of a Plp1-tg transplant recipient, 14 days post transplantation. ( B ) Corpus callosum of another transplant recipient showing that transplanted GFP-positive neurospheres form MBP-positive myelin. ( C and D ) Electron micrographs showing that the transplanted cells generate oligodendrocytes that wrap axons with normal-appearing myelin sheaths in which the inner tongue (black arrow), periaxonal space (arrowhead)
Gruenenfelder, McLaughlin, Griffiths et al 2020, Brain · undefined · source
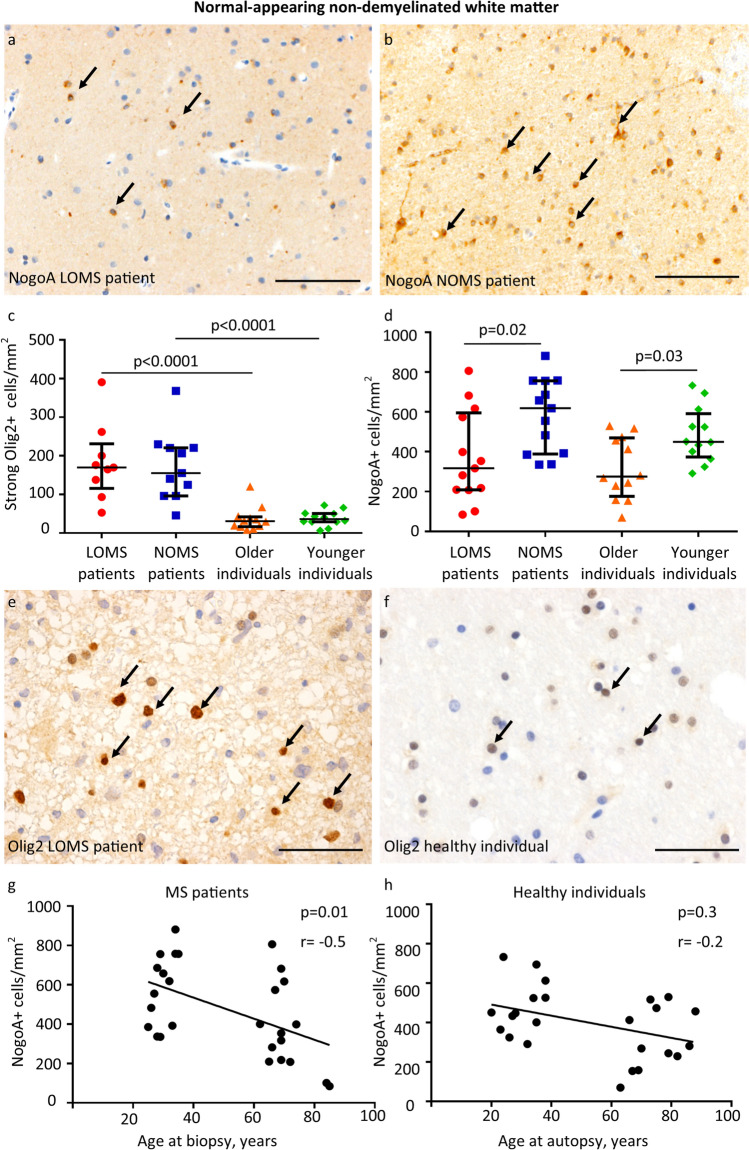
Anti-Olig2 staining of the white matter of a healthy older individual: Both strongly (arrows) and weakly Olig2-positive nuclei are identified.
Stork L, Stephan J, Kutllovci A et al. Impaired remyelination in late-onset multiple sclerosis. Acta Neuropathol. 2025. PMID 40167776 · undefined · source
Fig 4. Indirect immunofluorescence marker characterization of oligodendrocyte progenitors derived from human iPS cells. Nuclei were stained with DAPI (blue). Results show reduced expression of early markers (A) A2B5 and (B) NG2 and increased protein expression of mid to late oligodendrocyte progenitors
All AH, Gharibani P, Gupta S, Bazley FA, Pashai N, Chou B-K, et al. · undefined · source
All AH, Gharibani P, Gupta S, Bazley FA, Pashai N, Chou B-K, et al. · undefined · source
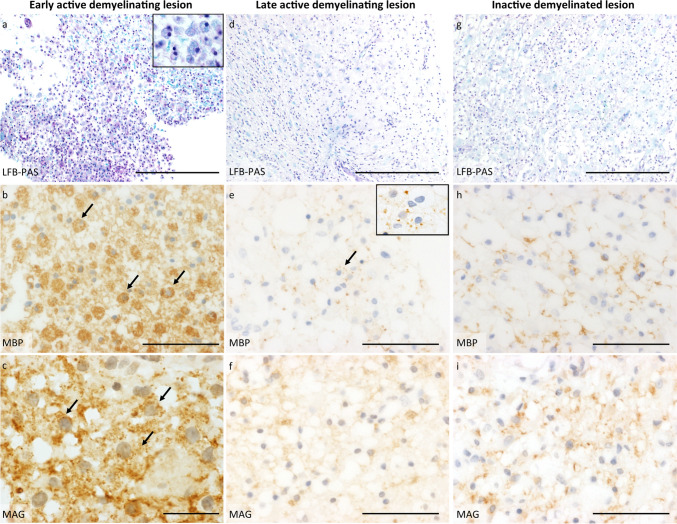
Histopathology of different demyelinating lesion activities. Panels a-c illustrate an early active demyelinating lesion, representing the initial stage of demyelination. At this stage, degradation products from both major (e.g., MBP) and minor (e.g., MAG) myelin proteins are present within phagocytes. a LFB/PAS staining reveals a demyelinated lesion containing multiple foamy macrophages. The inset shows an enlarged microscopic image of foamy macrophages with LFB-positive myelin debris; b Anti-myelin basic protein (MBP) staining of the early active lesion reflects myelin destruction and highlights numerous macrophages filled with myelin degradation products; c Anti-myelin-associated glycoprotein (MAG) staining also shows multiple macrophages containing MAG-positive degradation products, a minor myelin protein. Panels d-f depict a late active demyelinating lesion, representing the subsequent stage of demyelination, where only degradation products from major myelin proteins (e.g., MBP) can be identified within phagocytes. d LFB/PAS staining shows a completely demyelinated lesion with reactive astrogliosis and foamy macrophages; e Anti-MBP staining reflects an advanced stage of demyelination, with only a few macrophages containing MBP-positive degradation products (see inset for MBP-positive macrophages); f In contrast, no degradation products from minor myelin proteins, such as MAG, are detected within macrophages, as demonstrated by anti-MAG staining. Panels g-i present an inactive demyelinated lesion, where no active demyelination processes are observed. g LFB/PAS staining reveals a demyelinated lesion accompanied by reactive astrogliosis and foamy macrophages; h Anti-MBP staining shows newly formed, thin myelinated fibers, indicating early remyelination. However, no myelin degradation products are observed within macrophages; i Anti-MAG staining also identifies early remyelination. LFB/PAS Luxol fast blue/periodic acid-Schiff, MBP myelin basic protein, MAG myelin-associated glycoprotein, Scale bars: a, d and g 200 um; b, f and i 50 um; e and h 100 um; c 20 um
Stork, Stephan, Kutllovci et al 2025, Acta Neuropathologica · undefined · source
Illustrations
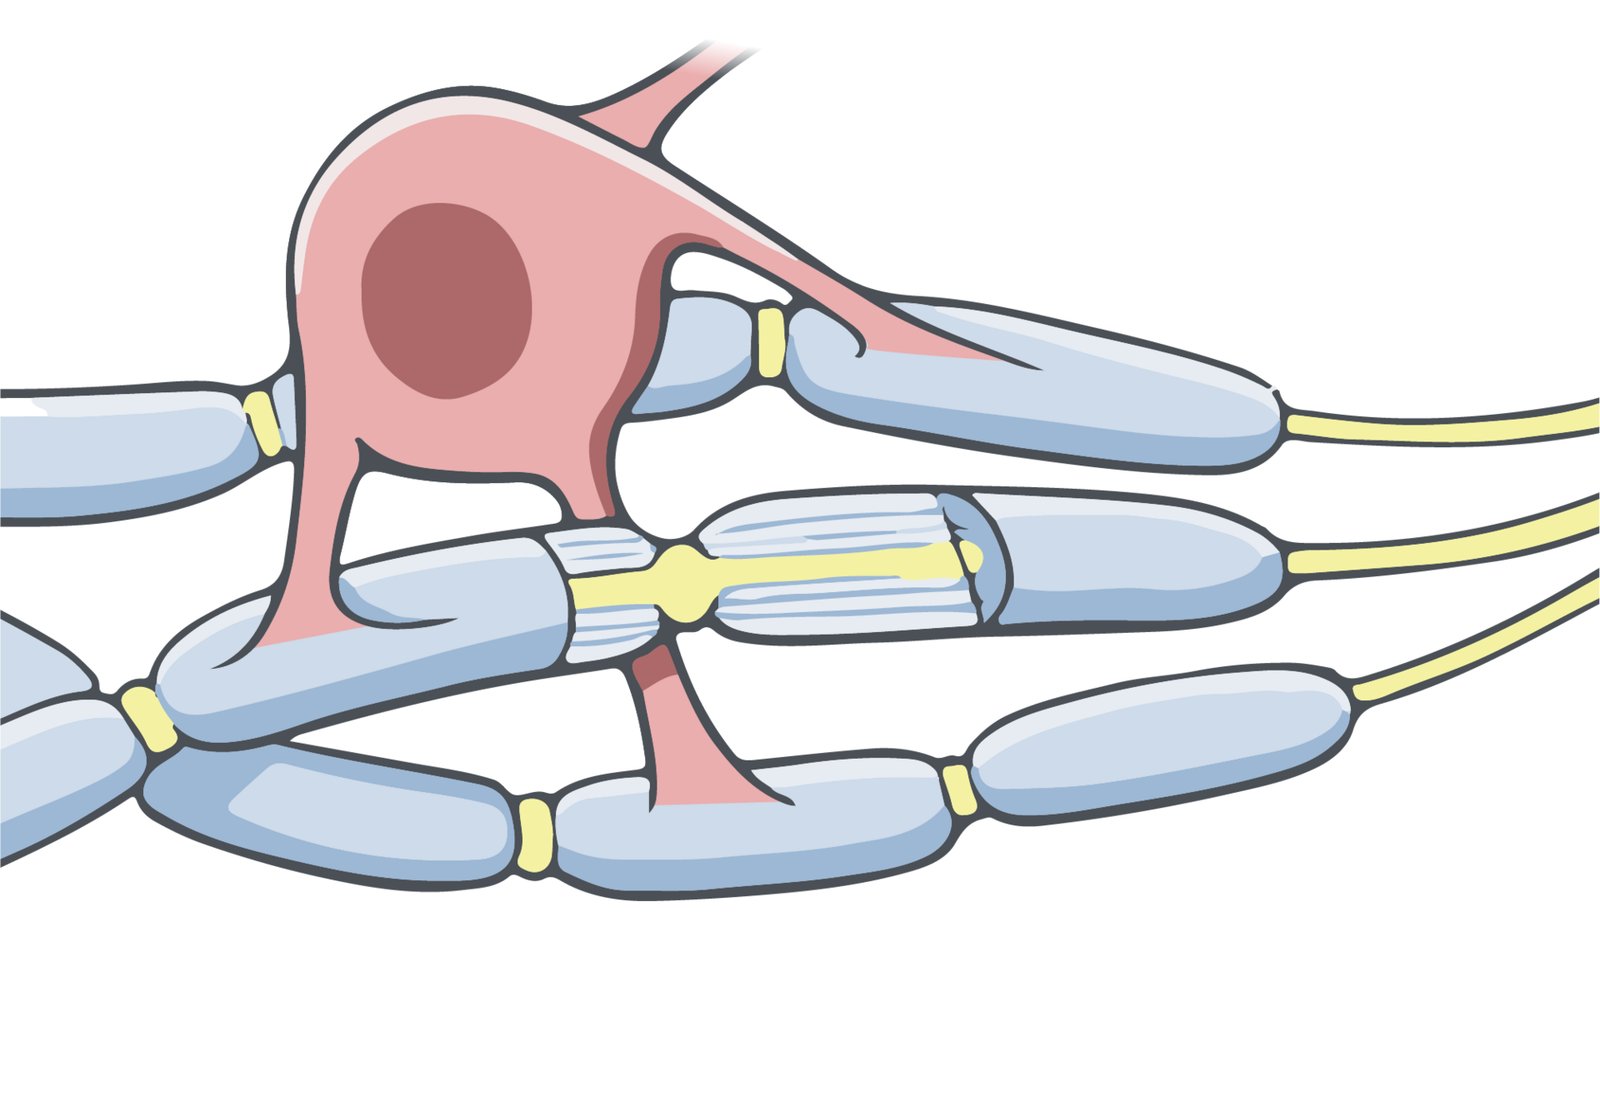
NIH BioArt illustration of an oligodendrocyte showing its branching processes, which wrap around multiple axons to form the myelin sheath. Public domain image courtesy of NIAID.
Courtesy of NIAID / Ryan Kissinger (Wikimedia Commons) · undefined · source
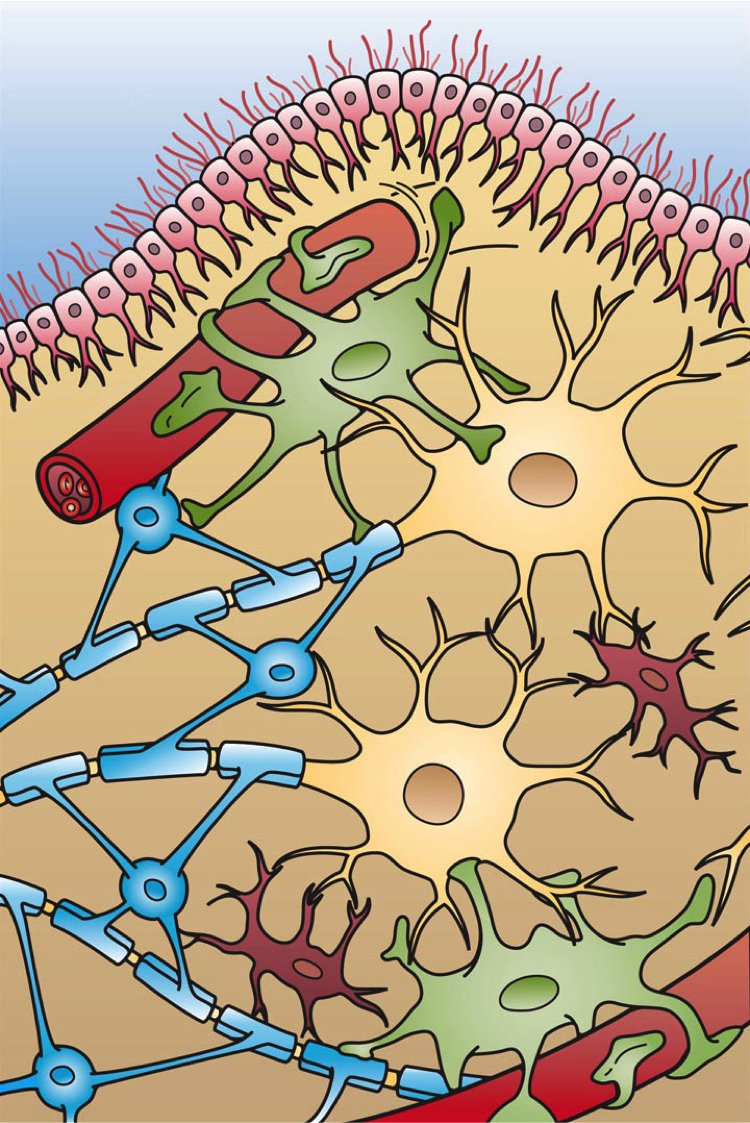
Scientific illustration showing the four types of glial cells in the CNS: ependymal cells, astrocytes, microglia, and oligodendrocytes. The oligodendrocyte is shown with processes wrapping around axons.
Artwork by Holly Fischer (Wikimedia Commons) · undefined · source
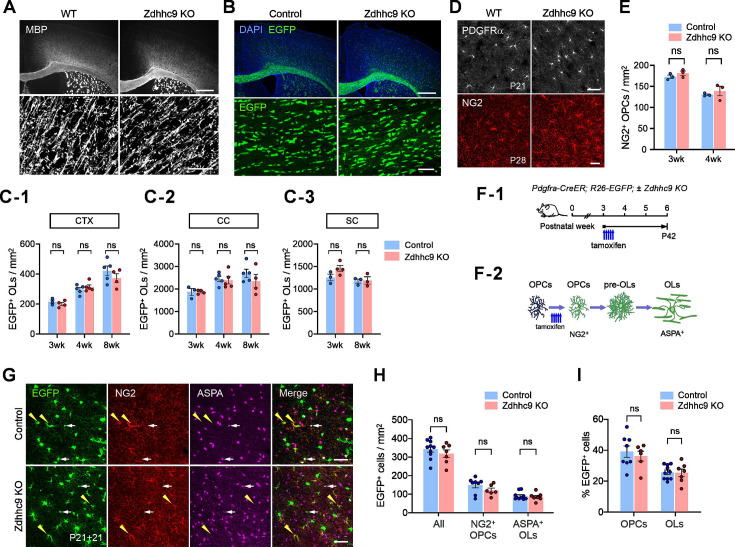
No detectable gross abnormality in oligodendrocyte development in Zdhhc9 KO mice. ( A ) Fluorescent (upper) an
Jeong, Gonzalez-Fernandez, Crawley et al 2025, eLife · undefined · source